Modelled Territorial Authority GDP 2024 release
The experimental Modelled Territorial Authority Gross Domestic Product (MTAGDP) allocates values to second tier local government administrative boundaries, i.e., the territorial authorities, from Stats NZ’s Regional GDP estimates.
On this page
While MTAGDP attempts to estimate and allocate GDP to particular territorial authorities, in practice the New Zealand economy is a single, interconnected, and often interdependent system. No territorial authority is self-contained, economic activities are carried out both within and across territorial authority boundaries, across regional boundaries and to non-adjacent regions as well as internationally. Despite this complexity, there is demand for estimates of GDP at a smaller local scales.
Measures of MTAGDP are used to quantify the size of local economies, to promote their investment appeal, as well as to highlight the importance of the territorial authority to both the regional and the national economy. This MTAGDP approach provides information at the territorial authority area level to facilitate a better understanding of local economies and their industries.
While the regional GDP estimates use firm-level data to apply a 'bottom-up' method, the MTAGDP model has a 'top-down' approach which uses as a base the regional estimates and disaggregates them to local levels. All annual values are considered as estimates, with the exception of the forecasts for the latest year which are provisional, and labelled as such.
For the 2024 release, we present results of a simplified model with estimates for the year ended March 2023 and updates for the previous years.
Key findings
- Over the five years to March 2023, nominal GDP grew in almost every territorial authority area. Especially high growth was observed in Ōpōtiki, Western Bay of Plenty, and Waimate.
- Inflation appears to be the main driver behind the changes in nominal trends of the five-year compound annual growth rate (CAGR) for the years of COVID-19 and immediately following.
- Auckland is New Zealand’s largest territorial authority area and remains New Zealand’s biggest contributor to national GDP and GDP growth, accounting for 38% of both the GDP, and the GDP growth, of New Zealand.
- Cities have a high proportion of their GDP found in services. In contrast, non-urban areas are either majority primary industry focused, or goods-producing mixed with primary industry output.
Downloadable data
Full data table for MTAGDP [CSV, 3.4 MB]
Nominal CAGR GDP grew in most regions and territorial authorities
- Over the five years to March 2023, strong growth was seen in most of the districts with total nominal GDP growing in 64 of the 66 territorial authority areas. GDP per capita grew in 62 of the 66 territorial authority areas. The four exceptions having negative GDP per capita growth are Waitomo, Westland, Carterton and Queenstown-Lakes. Of these only Queenstown-Lakes had an increase in nominal GDP and a coincident decline in GDP per capita.
- These MTAGDP growth rates contrast with the overall New Zealand CAGR in GDP of +5.7%, and +4.4% in GDP per capita. Territorial authority GDP growth rates exceeding the New Zealand average were seen in 32 of the 66 territorial authority areas. With GDP not uniformly keeping pace with population growth, in only 22 of the 66 territorial authorities was CAGR in per capita GDP above the national value.
- As has typically been seen, there were a couple of districts showing negative growth. The district with the least estimated growth in both total GDP and GDP per capita was Waitomo in the North Island, which experienced total GDP CAGR of -0.6% and -0.8% in GDP per capita CAGR. This was followed by the Westland district in West Coast region of the South Island with -0.3% total GDP CAGR and -0.5% GDP per capita CAGR. These declines primarily reflect the effect of a reduction in tourism in the two local economies. Waitomo’s local economy revolves around caves visitors, and in 2022 saw local earnings in administrative and support services affected by the closing of travel agencies, as well as the flow-on reduction in rental and hiring. Similarly, Westland was already predicting in 2021 that employment in the region would be negatively affected by COVID and that recovery would not be underway until 2023.
- In the Bay of Plenty region, strong five-year CAGRs were seen in Ōpōtiki (+10.3%), Western Bay of Plenty (+9.7%), and Tauranga (+8.2%).
- Two territorial authority areas in the Canterbury region had strong five-years CAGRs: Waimate (+9.1%) and Waimakariri (+7.7%).
- In the Wellington region there was a mix between areas that show a significant nominal growth in CAGR, such as Kāpiti (+8.3%), and areas like Carterton that show neither positive or negative growth.
- The Horowhenua district in the Manawatū - Whanganui region had significant growth of +8.5%, almost twice the New Zealand rate.
As seen in Figure 1, for the 2023 year, the majority of areas show positive nominal GDP growth. Overall for most territorial authorities, the growth seen in 2023 is above or equal that of the growth experienced in 2020.
Figure 1: Five-year growth in nominal GDP by territorial authority for 2020 and 2023
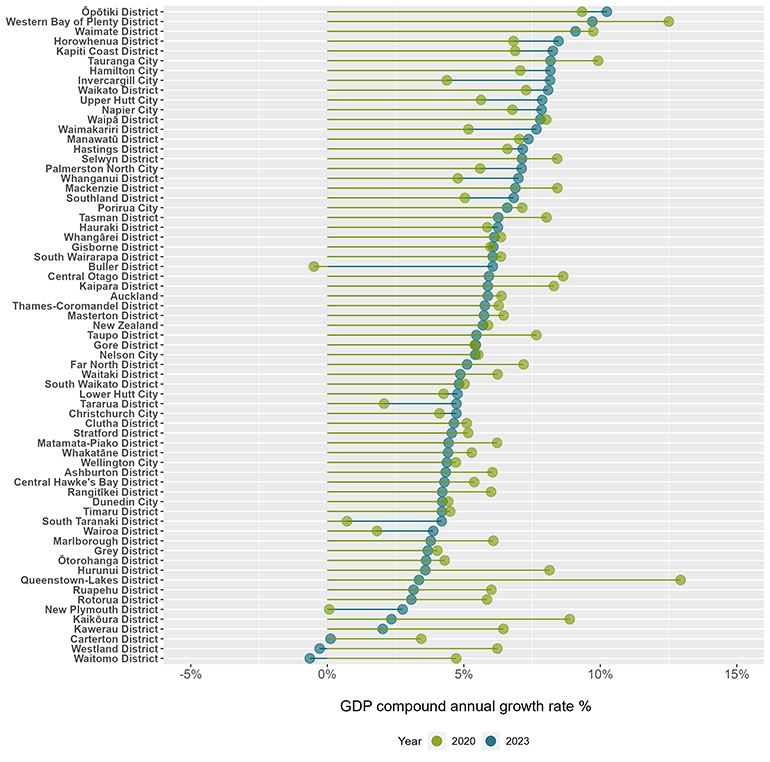
Chart description
Population growth was not the only driver of growth in nominal GDP
Growth in per capita GDP is a useful measure because it removes changes that are only due to population growth. Annual nominal GDP per capita for the year ended March 2023 increased in 62 of the 66 territorial authority areas, and decreased in another four, as portrayed in Figure 2.
- The highest GDP per capita growth was observed in Ōpōtiki and Waimate, which both had +8.4% in CAGR.
- Waimate and Ōpōtiki had the highest 5-years CAGR in GDP per capita at +8.4%, followed by Invercargill with +7.4%, and Kāpiti with +7.1%.
- The Carterton territorial authority had the largest annual fall in per capita GDP -1.4%, followed by Queenstown-Lakes with -1.0%, Waitomo with -0.8% and Westland with -0.5%. For most of these territorial authorities, the negative growth in GDP per capita was driven by an increase in population that outpaced the contemporaneous growth in GDP.
Figure 2: Five-year growth in per capita GDP by territorial authority area for 2020 and 2023
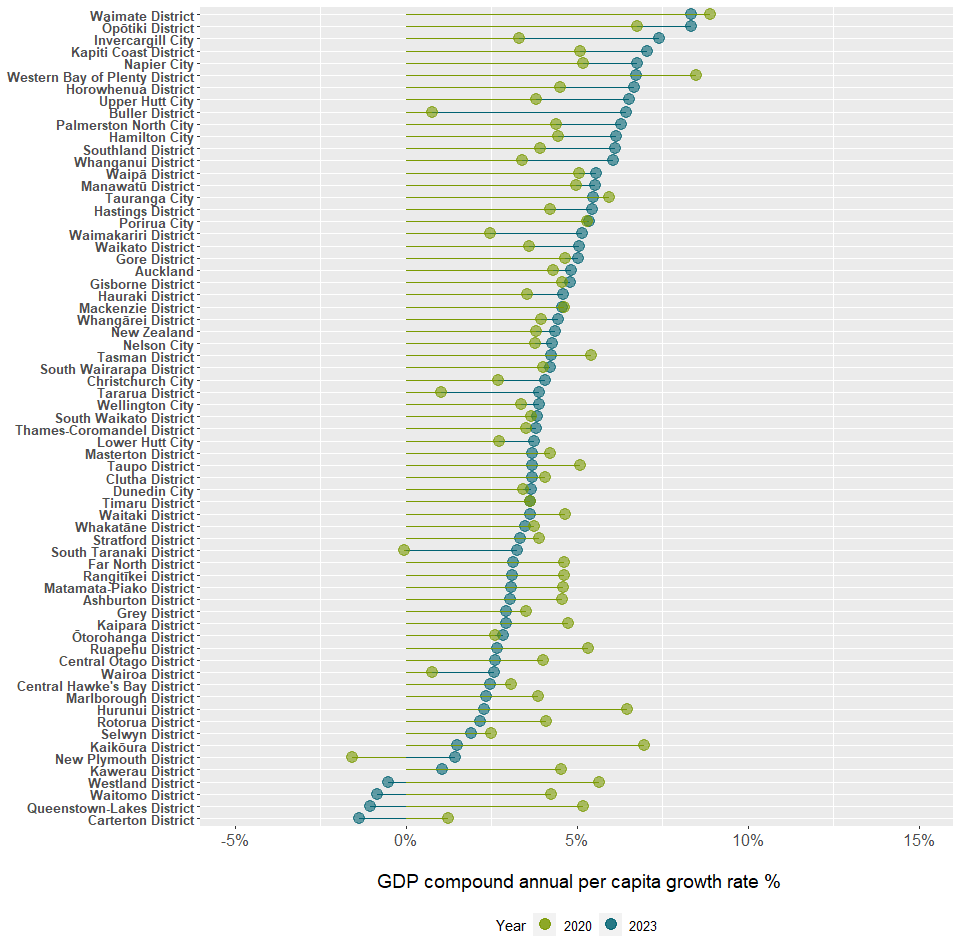
Chart description
To visualise the spatial distribution in the GDP per capita CAGR, the latest years figures were mapped as a choropleth using the territorial authority administrative boundaries (Figure 3). From the map, there appears to be a recent shift in the distribution of the nominal GDP growth across the country from the touristic areas and towards the main urban centres. The exception was Southland, which saw a post-COVID boost on international visitors that had a positive impact on the territory.
Figure 3: Choropleth of territorial authority GDP per capita five-year CAGR
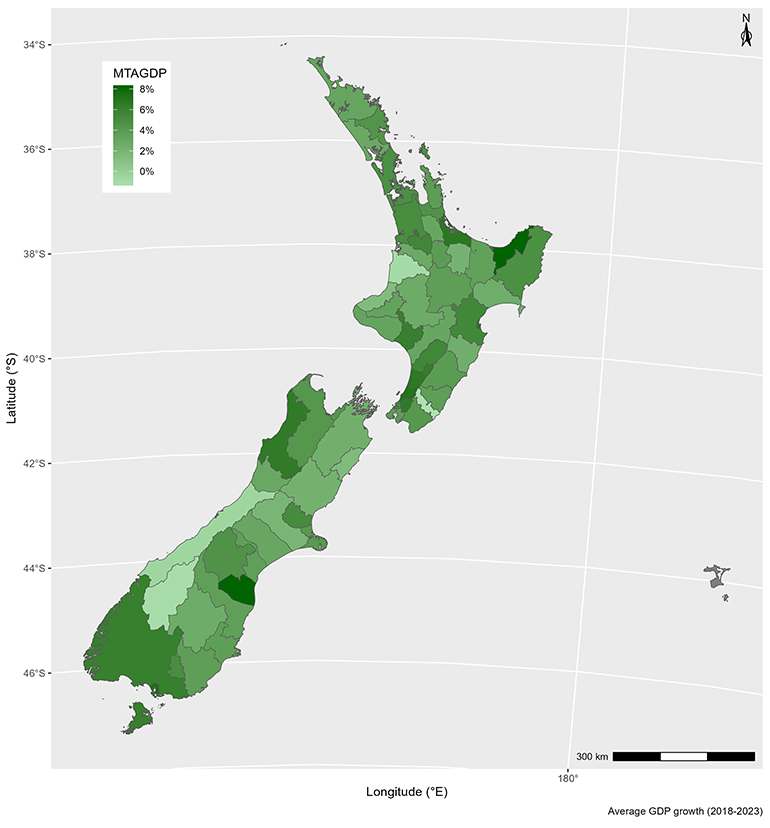
Chart description
Metropolitan Comparison
The three metropolitan areas are: Auckland (the area covered by the Auckland Council); Wellington Met (comprised of Wellington City, Lower Hutt City, Upper Hutt City, and Porirua City); and Christchurch Met (comprised of Christchurch City, Selwyn, and Waimakariri districts). The figure below (Figure 4), presents a comparison of the three main metropolitan areas showing that all follow the same up-ward trend in the post-COVID years, returning to the pre-COVID trend after the noticeable COVID disruption.
As also highlighted in previous MTAGDP releases, the GDP per capita of the Auckland, Wellington and Christchurch metropolitan areas was higher than the New Zealand average.
Wellington’s GDP per capita continues being above all other metropolitan areas. While Auckland’s per capita GDP remains lower than Wellington’s, the total GDP for this metro is four times larger than Wellington’s because of Auckland’s much larger population. The difference in GDP per capita between the political capital and the financial capital has narrowed from approximately ~$14,000 per capita in 2009 to ~$12,000 for 2023.
On the other hand, Christchurch Met GDP per capita shows a marked drop in 2021, followed by a self-correction to the previous years’ trend values in 2023.
Figure 4: Annual nominal GDP per capita for the main metropolitan areas, 2009-2023
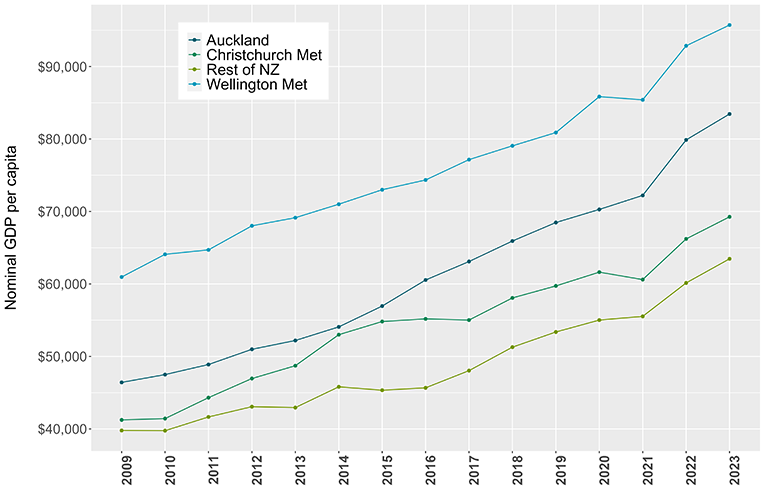
Chart description
Industry shares of GDP within territorial authorities
The distribution of GDP across industries was evaluated across all territorial authorities, and it is seen to differ among the authorities. Industry types were defined in accordance with the 2021 MTAGDP release.
Figure 5 shows the share of industry types across the country. Overall, New Zealand’s industry composition is dominated by the service industries. The exceptions are: Southland, Waimate and Hurunui that are primary industry dominated, reflecting the rural nature of those areas; and the urban areas such as Kawarau, Carterton, and Matamata-Piako, which have a significant proportion of industry (primarily comprised of the goods-producing industries).
Figure 5: Map of industry composition by territorial authority. Points are sized by the industry’s share of total GDP (excluding taxes) over the 2018-2023 period
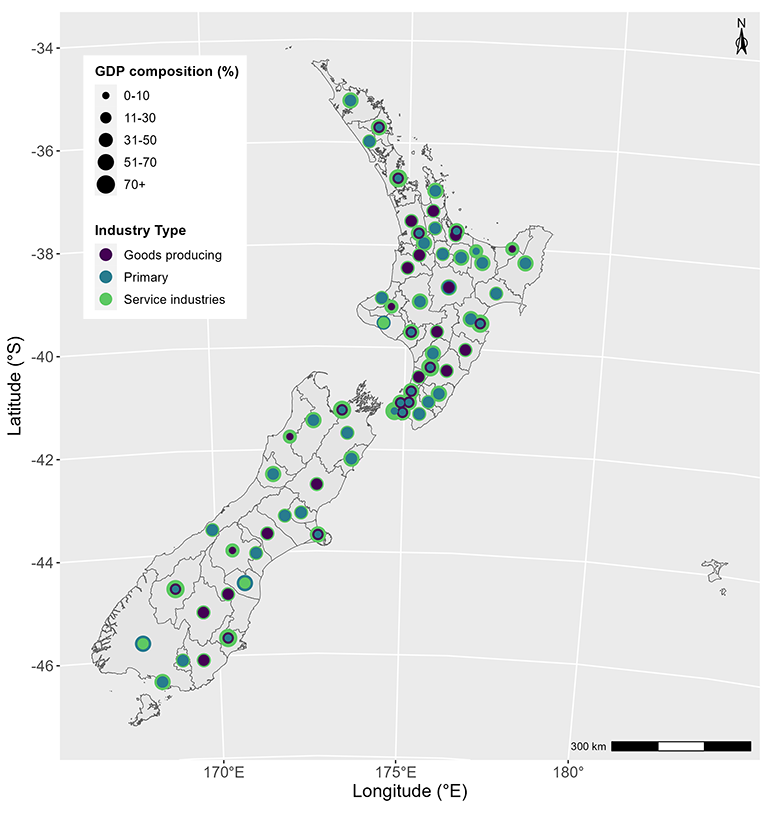
Chart description
Comparing the COVID and post-COVID years, at the industry level Accommodation and Transport were the two industries having a negative compound annual growth rate (Figure 6). Both these industries have a significant relationship with tourism.
Figure 6: GDP CAGR by Industry for New Zealand in each year 2020-2023
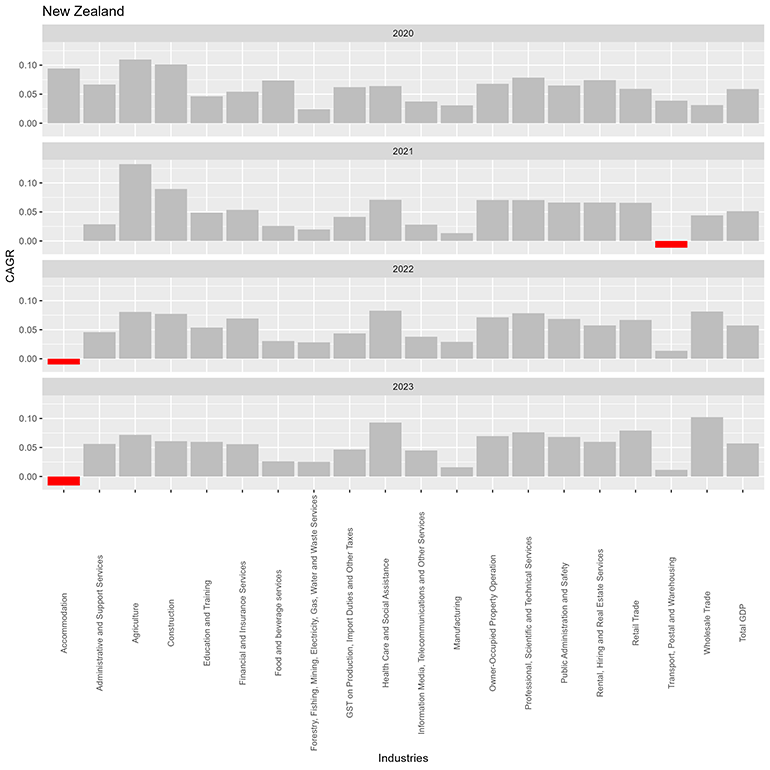
Chart description
Table 1 below shows a selection of GDP metrics by industry for this 2024 release.
Table 1: Table of GDP, GDP year on year difference, and GDP CAGR for each Industry in the year 2023
| Industry | GDP* | GDP estimate growth** | GDP CAGR*** |
|---|---|---|---|
| Accommodation | 1,778 | -144 | -1.5% |
| Transport, Postal and Warehousing | 13,664 | 755 | 1.1% |
| Manufacturing | 32,083 | 2,444 | 1.6% |
| Forestry, Fishing, Mining, Electricity, Gas, Water and Waste Services | 17,475 | 2,049 | 2.5% |
| Food and beverage services | 5,048 | 611 | 2.6% |
| Information Media, Telecommunications and Other Services | 19,792 | 3,903 | 4.5% |
| GST on Production, Import Duties and Other Taxes | 31,143 | 6,329 | 4.6% |
| Financial and Insurance Services | 21,329 | 5,067 | 5.6% |
| Administrative and Support Services | 7,527 | 1,798 | 5.6% |
| Education and Training | 16,400 | 4,126 | 6.0% |
| Rental, Hiring and Real Estate Services | 27,442 | 6,906 | 6.0% |
| Construction | 25,548 | 6,538 | 6.1% |
| Public Administration and Safety | 16,030 | 4,500 | 6.8% |
| Owner-Occupied Property Operation | 29,081 | 8,308 | 7.0% |
| Agriculture | 17,825 | 5,216 | 7.2% |
| Professional, Scientific and Technical Services | 33,765 | 10,376 | 7.6% |
| Retail Trade | 18,869 | 5,974 | 7.9% |
| Health Care and Social Assistance | 26,052 | 9,346 | 9.3% |
| Wholesale Trade | 22,746 | 8,771 | 10.2% |
| Total GDP | 383,597 | 92,873 | 5.7% |
* GDP Estimate for 2023
** Difference between the GDP estimates for 2023 and 2022
*** CAGR for the 2023 GDP estimate
Explore further
You can explore MTAGDP data graphically in our Regional Economic Activity Tools