Energy indicators
Energy indicators are used to track and monitor different aspects of a country's energy system such as share of renewables in energy use, energy intensity, and self-sufficiency.
On this page I tēnei whārangi
Share of electricity generation from renewables reaches the highest level since 1981
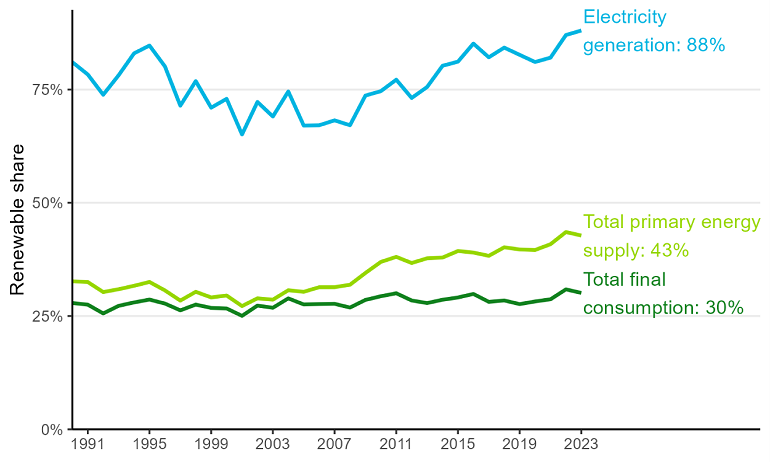
The share of renewables in electricity generation reached 88% in 2023, up by 1% on 2022’s previous record high since the early 1980s. This increase was due to higher levels of electricity generation from hydro, wind, and solar, leading to less reliance on coal- and gas-fired generation to meet demand.
The share of renewables in total final consumption fell slightly from 2022’s record high, down 0.8 percentage points to 30.1% in 2023. Contributing to this was increases in the consumption of refined oil products (such as petrol and aviation fuels) offsetting the increase in the use of renewable electricity.
The share of renewables in total primary energy supply fell slightly, down 0.7 percentage points to 42.8%. This was driven by an increase in the supply of oil products, and a fall in the supply of woody biomass.
Total primary energy supply: The total amount of energy available for use in New Zealand, accounting for domestic production and trade.
Total final consumption: Energy consumed by end-users such as factories and businesses.
Figure 1. Renewables in electricity generation, energy supply, and energy consumption – 1990 to 2023
View chart data for figure 1
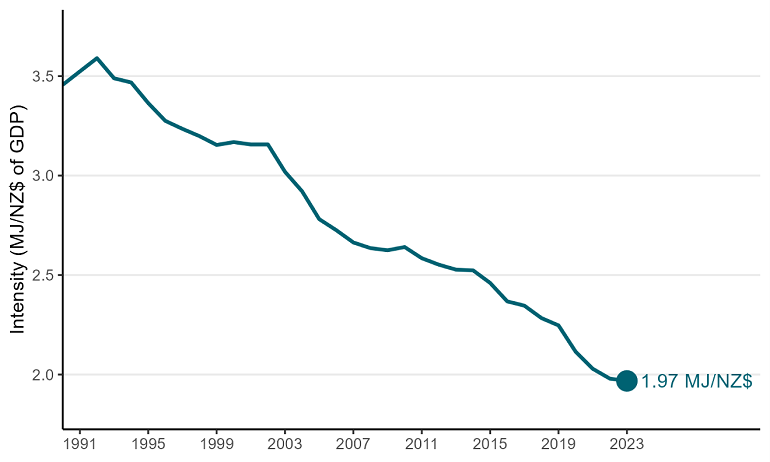
Energy intensity gives an indication of the relationship between energy use and economic growth. It is calculated as energy use divided by gross domestic product (GDP) and tells us the amount of energy required to produce each dollar of GDP. A fall in the indicator – where less energy is required to produce each dollar of GDP – is viewed as an improvement.
If energy intensity decreases, it is usually due to:
- Energy users within a sector are finding ways to use energy more efficiently, increasing the energy efficiency of the sector, or
- Activity shifts from more energy-intensive sectors to less energy-intensive sectors, resulting in a lower overall energy intensity.
Energy intensity unchanged as commercial growth slows
The sustained decline in national energy intensity flattened out in 2023, with national average energy intensity relatively unchanged at 1.97 megajoules per dollar (MJ/$) in 2023. This was mainly due to a slowing of in gross domestic product (GDP) growth, notably in the commercial sector.
Figure 2. National energy intensity – 1990 to 2023 (MJ/$NZ)
View chart data for figure 2
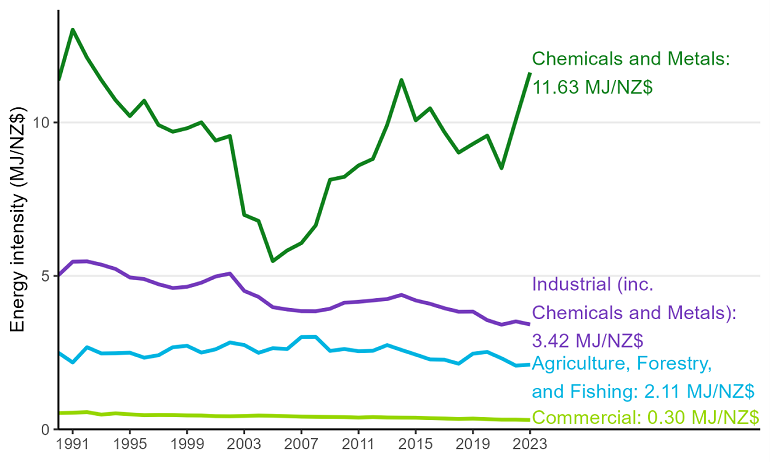
The decline in national average energy intensity over the last decade had been driven by the commercial sector, which is relatively less energy intensive than other parts of the economy (as it is service based) and is a large contributor to national GDP.
Figure 3. Energy intensity by sector – 1990 to 2023 (MJ/$NZ)
View chart data for figure 3
Self-sufficiency remained unchanged
New Zealand relies on a combination of domestically produced and imported fuels to meet its energy needs. A common metric used internationally to measure this is a self-sufficiency indicator, which shows how well we can meet our own energy supply needs through domestic production.
In 2023, national self-sufficiency remained unchanged in at 73%. Key contributors to New Zealand’s energy self-sufficiency are coal and oil — the 2 fuels which New Zealand trades internationally.
Self-sufficiency: The ability of a country to meet its own energy supply needs through domestic production.
A value of 100% indicates that a country produces all the energy it needs, whereas values above or below 100% indicates it is a net exporter or importer of energy, respectively.