Electricity
New Zealand’s electricity is mostly generated through renewable sources such as hydro and geothermal energy. Our renewable generation is supplemented by thermal ‘peaker’ plants when demand is high or during dry periods when hydro stores are low.
On this page
I tēnei whārangi
Highest level of electricity generation from renewables on record
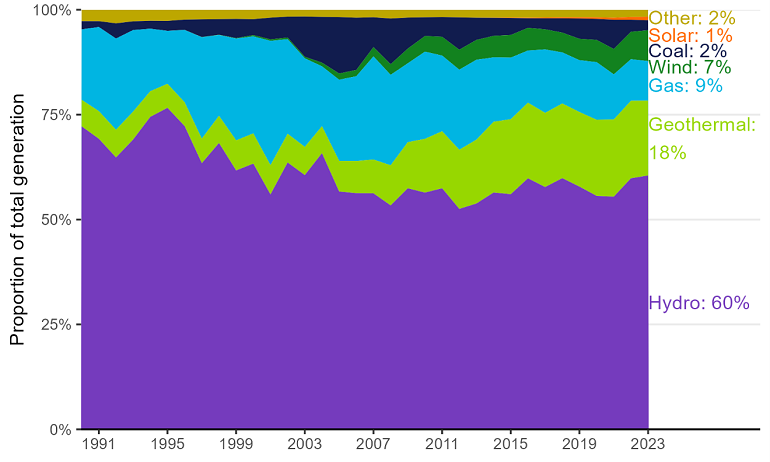
The level of electricity generation from renewable sources reached its highest level on record driven by increases in hydro, wind, and solar generation. This led to the renewable share of electricity generation reaching 88.1%, its highest level since 1981.
Net generation refers to the amount of electricity generated minus what was used by the generating plant itself (called the ‘parasitic load’).
Total electricity generation stayed steady in 2023 at 43,488 Gigawatt hours (GWh). Hydro generation, which made up 60.5% of net generation in 2023, increased by 1.1% (296 GWh) to 26,309 GWh. This was the highest level of hydro generation since 2004, driven by heavy rainfall in hydro catchment areas, and follows 2022 which also saw favourable hydro conditions. Wind generation increased by 13% (369 GWh) to 3,206 GWh, with new capacity coming online with the commissioning of the Kaiwera Downs Stage 1 and Harapaki wind farms. Solar generation increased by 30.3% (85 GWh) to 367 GWh, mostly due to further installations of distributed solar panels (such as on households). Additionally, November 2023 saw the commissioning of the Kohirā solar farm in Kaitaia, the first utility-scale solar farm in New Zealand.
Geothermal generation was down by 3.4% (275 GWh) to 7,758 GWh. Contributing to this were outages at several plants (both planned and unplanned).
The increase in renewable electricity generation meant less generation was required from non-renewable sources. Gas generation was down 4.9% (212 GWh) to 4,097 GWh, while coal generation dropped by 17.6% (220 GWh) to 1,031 GWh.
Figure 4. Electricity generation by plant type – 1990 to 2023 (GWh)
View chart data for figure 4
Table: Electricity generation by plant type 1990 to 2023 (Gigawatt hours)
| Year |
Hydro |
Geo-
thermal |
Biogas |
Wood |
Wind |
Solar |
Oil |
Coal |
Gas |
Waste heat |
| 1990 |
22,953 |
2,011 |
131 |
664 |
|
|
9 |
620 |
5,336 |
63 |
| 1991 |
22,666 |
2,158 |
151 |
656 |
|
|
24 |
451 |
6,561 |
63 |
| 1992 |
20,882 |
2,131 |
156 |
629 |
1 |
|
192 |
1,171 |
7,006 |
63 |
| 1993 |
23,258 |
2,247 |
156 |
655 |
1 |
|
59 |
696 |
6,543 |
63 |
| 1994 |
25,579 |
2,101 |
162 |
658 |
1 |
|
20 |
647 |
5,117 |
63 |
| 1995 |
27,259 |
2,039 |
172 |
662 |
1 |
|
48 |
842 |
4,489 |
63 |
| 1996 |
25,921 |
2,038 |
146 |
620 |
8 |
|
15 |
876 |
6,183 |
63 |
| 1997 |
23,026 |
2,130 |
139 |
624 |
13 |
|
|
1,535 |
8,775 |
63 |
| 1998 |
25,066 |
2,386 |
137 |
620 |
22 |
|
1 |
1,365 |
7,074 |
63 |
| 1999 |
22,690 |
2,636 |
116 |
627 |
39 |
|
0 |
1,678 |
8,927 |
63 |
| 2000 |
24,191 |
2,756 |
103 |
695 |
119 |
|
0 |
1,445 |
8,829 |
63 |
| 2001 |
21,464 |
2,678 |
101 |
575 |
138 |
|
|
1,980 |
11,362 |
47 |
| 2002 |
24,624 |
2,655 |
131 |
413 |
154 |
|
0 |
1,926 |
8,723 |
93 |
| 2003 |
23,387 |
2,595 |
167 |
351 |
145 |
|
19 |
3,701 |
8,145 |
84 |
| 2004 |
26,968 |
2,631 |
186 |
408 |
358 |
|
23 |
4,464 |
5,851 |
83 |
| 2005 |
23,094 |
2,981 |
190 |
446 |
608 |
|
4 |
5,471 |
7,879 |
76 |
| 2006 |
23,337 |
3,177 |
218 |
473 |
616 |
|
23 |
5,167 |
8,378 |
71 |
| 2007 |
23,404 |
3,354 |
210 |
481 |
921 |
3 |
1 |
2,954 |
10,229 |
53 |
| 2008 |
22,124 |
3,966 |
203 |
480 |
1,048 |
3 |
124 |
4,515 |
8,937 |
56 |
| 2009 |
23,975 |
4,589 |
215 |
499 |
1,462 |
4 |
9 |
3,082 |
7,848 |
53 |
| 2010 |
24,479 |
5,559 |
218 |
502 |
1,620 |
4 |
2 |
1,929 |
9,018 |
57 |
| 2011 |
24,860 |
5,884 |
218 |
488 |
1,936 |
4 |
2 |
2,028 |
7,804 |
46 |
| 2012 |
22,668 |
6,084 |
211 |
533 |
2,057 |
5 |
3 |
3,317 |
8,236 |
35 |
| 2013 |
22,799 |
6,449 |
203 |
548 |
2,000 |
7 |
3 |
2,237 |
8,069 |
44 |
| 2014 |
24,075 |
7,195 |
228 |
522 |
2,189 |
19 |
3 |
1,831 |
6,547 |
47 |
| 2015 |
24,285 |
7,749 |
244 |
519 |
2,340 |
36 |
1 |
1,753 |
6,361 |
49 |
| 2016 |
25,676 |
7,738 |
265 |
496 |
2,317 |
56 |
3 |
979 |
5,338 |
51 |
| 2017 |
24,924 |
7,632 |
264 |
485 |
2,070 |
76 |
6 |
1,133 |
6,527 |
46 |
| 2018 |
25,992 |
7,729 |
262 |
463 |
2,047 |
100 |
11 |
1,479 |
5,287 |
49 |
| 2019 |
25,343 |
7,793 |
267 |
472 |
2,233 |
127 |
4 |
2,118 |
5,413 |
45 |
| 2020 |
24,024 |
7,834 |
271 |
460 |
2,286 |
159 |
13 |
2,159 |
5,934 |
40 |
| 2021 |
23,992 |
7,968 |
265 |
483 |
2,618 |
208 |
26 |
3,020 |
4,651 |
43 |
| 2022 |
26,013 |
8,033 |
266 |
439 |
2,837 |
281 |
7 |
1,251 |
4,310 |
40 |
| 2023 |
26,309 |
7,758 |
275 |
408 |
3,206 |
367 |
4 |
1,031 |
4,097 |
33 |
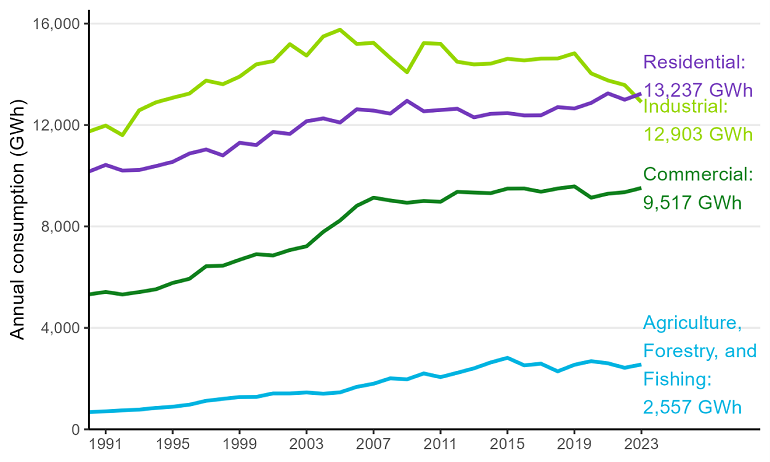
Residential sector surpasses industrial to become largest consumer of electricity
National electricity consumption was also relatively unchanged, up 0.2% (69 GWh) to 39,130 GWh in 2023. For the first time, residential consumption surpassed industrial consumption to become the largest sector of electricity consumption in New Zealand. Consumption by the residential sector has grown by 4.6% (587 GWh) over the last 5 years, with over 75,000 new residential connection points added over this period.
Figure 5. Electricity consumption by sector – 1990 to 2023 (GWh)
View chart data for figure 5
Table: Electricity consumption by sector
| Year |
Agriculture,
forestry,
and fishing |
Industrial |
Commercial |
Residential |
Transport |
| 1990 |
678.81 |
11744.68 |
5320.61 |
10164.24 |
61.21 |
| 1991 |
708.54 |
11977.21 |
5416.92 |
10426.60 |
53.83 |
| 1992 |
748.35 |
11600.57 |
5316.93 |
10203.51 |
55.37 |
| 1993 |
777.09 |
12580.18 |
5412.14 |
10226.04 |
61.26 |
| 1994 |
843.30 |
12892.98 |
5520.82 |
10379.66 |
65.50 |
| 1995 |
891.37 |
13073.21 |
5771.69 |
10546.19 |
66.78 |
| 1996 |
970.45 |
13239.22 |
5934.32 |
10874.15 |
67.93 |
| 1997 |
1124.98 |
13752.37 |
6431.61 |
11034.75 |
72.41 |
| 1998 |
1200.25 |
13608.04 |
6450.73 |
10800.22 |
72.80 |
| 1999 |
1272.15 |
13908.24 |
6685.77 |
11298.54 |
73.64 |
| 2000 |
1279.02 |
14392.28 |
6903.98 |
11210.48 |
72.67 |
| 2001 |
1415.33 |
14515.64 |
6855.65 |
11725.17 |
70.66 |
| 2002 |
1415.90 |
15187.22 |
7068.46 |
11648.62 |
70.79 |
| 2003 |
1452.69 |
14737.35 |
7216.91 |
12148.56 |
69.64 |
| 2004 |
1405.28 |
15492.67 |
7788.55 |
12259.62 |
71.12 |
| 2005 |
1456.98 |
15755.93 |
8234.08 |
12096.97 |
70.37 |
| 2006 |
1674.67 |
15195.30 |
8814.50 |
12620.26 |
66.45 |
| 2007 |
1797.36 |
15240.20 |
9132.99 |
12567.05 |
66.50 |
| 2008 |
2011.02 |
14643.52 |
9024.97 |
12448.82 |
65.55 |
| 2009 |
1971.99 |
14080.57 |
8933.36 |
12953.74 |
59.14 |
| 2010 |
2202.95 |
15229.24 |
9005.00 |
12539.98 |
64.21 |
| 2011 |
2058.47 |
15200.75 |
8972.03 |
12592.28 |
68.02 |
| 2012 |
2228.32 |
14492.24 |
9363.69 |
12640.84 |
69.90 |
| 2013 |
2405.01 |
14390.47 |
9336.15 |
12301.63 |
67.00 |
| 2014 |
2637.22 |
14420.18 |
9311.86 |
12441.12 |
68.77 |
| 2015 |
2818.79 |
14609.36 |
9491.22 |
12469.07 |
83.44 |
| 2016 |
2523.73 |
14547.21 |
9495.64 |
12377.22 |
91.00 |
| 2017 |
2588.28 |
14616.03 |
9368.49 |
12381.75 |
90.96 |
| 2018 |
2285.45 |
14621.50 |
9493.87 |
12703.00 |
93.88 |
| 2019 |
2545.19 |
14827.49 |
9579.49 |
12650.54 |
108.42 |
| 2020 |
2687.27 |
14035.11 |
9134.47 |
12871.77 |
111.52 |
| 2021 |
2603.57 |
13757.58 |
9290.38 |
13247.47 |
132.58 |
| 2022 |
2426.12 |
13575.77 |
9349.89 |
12997.84 |
193.33 |
| 2023 |
2557.17 |
12902.59 |
9516.70 |
13237.25 |
275.25 |
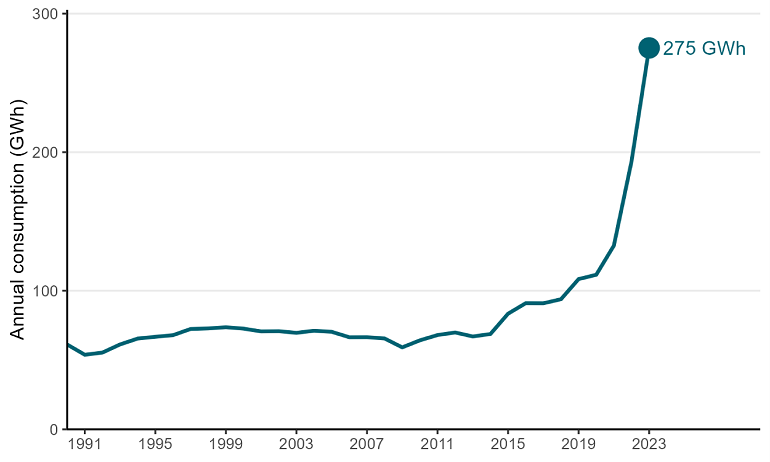
Electricity consumption for transport, although starting from a relatively lower base, has seen sustained growth over recent years. In 2023, consumption by the sector increased by 42.4% (82 GWh) to 275 GWh, with increased uptake of electric vehicles (EVs) over the last couple of years contributing to this. There were 76,506 battery electric vehicles in New Zealand’s motor vehicle fleet at the end of 2023, compared with only 29, 292 at the end of 2021.
Fleet statistics(external link) — Ministry of Transport
Figure 6. Electricity consumption in transport sector – 1990 to 2023 (GWh)
View chart data for figure 6
Table: Electricity consumption in transport sector
| Year |
Transport |
| 1990 |
61.21 |
| 1991 |
53.83 |
| 1992 |
55.37 |
| 1993 |
61.26 |
| 1994 |
65.50 |
| 1995 |
66.78 |
| 1996 |
67.93 |
| 1997 |
72.41 |
| 1998 |
72.80 |
| 1999 |
73.64 |
| 2000 |
72.67 |
| 2001 |
70.66 |
| 2002 |
70.79 |
| 2003 |
69.64 |
| 2004 |
71.12 |
| 2005 |
70.37 |
| 2006 |
66.45 |
| 2007 |
66.50 |
| 2008 |
65.55 |
| 2009 |
59.14 |
| 2010 |
64.21 |
| 2011 |
68.02 |
| 2012 |
69.90 |
| 2013 |
67.00 |
| 2014 |
68.77 |
| 2015 |
83.44 |
| 2016 |
91.00 |
| 2017 |
90.96 |
| 2018 |
93.88 |
| 2019 |
108.42 |
| 2020 |
111.52 |
| 2021 |
132.58 |
| 2022 |
193.33 |
| 2023 |
275.25 |
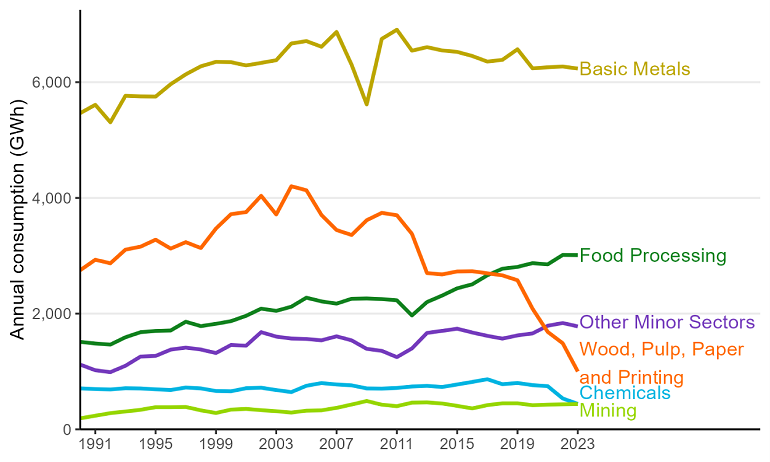
Industrial consumption continues decline due to decreased demand from the wood processing sector
Industrial electricity consumption decreased by 5% (673 GWh) in 2023 to 12,903 GWh. Electricity use by the industrial sector has been declining in recent years, with decreases in the wood, pulp, and paper processing sector contributing to this.
Electricity consumption in the wood processing sector decreased by 32.8% (488 GWh) in 2023 to 999 GWh. This was 61.2% (1,577 GWh) lower than 5 years ago in 2019. Contributing to this was the closure of Norske Skog Tasman’s newsprint mill in Kawerau at the end of June 2021, as well as a reduction in the activity of the sector in 2023 due to the impacts of Cyclone Gabrielle.
Figure 7. Industrial electricity consumption – 1990 to 2023 (GWh)
View chart data for figure 7
Table: Industrial electricity consumption from 1990 to 2023 (gigawatt hours)
| Year |
Mining |
Food processing |
Wood, pulp,
paper, printing |
Chemicals |
Basic metals |
Other minor sectors |
| 1990 |
191.04 |
1510.92 |
2750.55 |
707.72 |
5465.71 |
1118.73 |
| 1991 |
234.72 |
1483.80 |
2931.35 |
696.37 |
5609.90 |
1021.06 |
| 1992 |
280.06 |
1464.84 |
2870.24 |
689.37 |
5307.69 |
988.37 |
| 1993 |
307.98 |
1591.35 |
3106.01 |
710.34 |
5765.93 |
1098.56 |
| 1994 |
337.73 |
1678.99 |
3157.27 |
706.43 |
5754.97 |
1257.59 |
| 1995 |
382.41 |
1700.21 |
3277.76 |
692.02 |
5751.74 |
1269.06 |
| 1996 |
382.65 |
1708.69 |
3124.23 |
680.19 |
5966.20 |
1377.25 |
| 1997 |
386.49 |
1860.03 |
3235.30 |
721.89 |
6136.24 |
1412.42 |
| 1998 |
328.47 |
1783.81 |
3133.73 |
707.59 |
6275.07 |
1379.37 |
| 1999 |
282.01 |
1823.89 |
3469.86 |
662.21 |
6351.62 |
1318.66 |
| 2000 |
341.05 |
1869.96 |
3719.43 |
657.45 |
6346.58 |
1457.82 |
| 2001 |
352.43 |
1961.92 |
3754.75 |
710.54 |
6290.42 |
1445.58 |
| 2002 |
331.74 |
2086.26 |
4036.56 |
718.93 |
6334.02 |
1679.72 |
| 2003 |
312.89 |
2047.58 |
3714.12 |
679.20 |
6380.61 |
1602.96 |
| 2004 |
289.58 |
2119.46 |
4201.68 |
643.35 |
6669.59 |
1569.01 |
| 2005 |
322.27 |
2275.56 |
4132.66 |
753.08 |
6710.71 |
1561.65 |
| 2006 |
328.36 |
2211.45 |
3704.69 |
798.80 |
6613.53 |
1538.47 |
| 2007 |
370.76 |
2172.68 |
3445.10 |
774.90 |
6869.02 |
1607.75 |
| 2008 |
428.26 |
2257.00 |
3359.19 |
760.47 |
6300.81 |
1537.80 |
| 2009 |
489.35 |
2262.36 |
3614.49 |
706.99 |
5616.64 |
1390.75 |
| 2010 |
425.52 |
2251.70 |
3741.84 |
704.15 |
6749.69 |
1356.34 |
| 2011 |
399.96 |
2230.08 |
3700.91 |
714.71 |
6907.19 |
1247.89 |
| 2012 |
461.14 |
1967.74 |
3378.69 |
740.59 |
6545.70 |
1398.38 |
| 2013 |
465.39 |
2200.45 |
2701.07 |
751.59 |
6605.64 |
1666.33 |
| 2014 |
446.47 |
2312.00 |
2677.89 |
732.27 |
6549.89 |
1701.65 |
| 2015 |
405.16 |
2437.47 |
2728.57 |
774.54 |
6524.29 |
1739.34 |
| 2016 |
361.53 |
2506.78 |
2732.46 |
819.31 |
6453.38 |
1673.74 |
| 2017 |
417.68 |
2662.63 |
2697.53 |
865.70 |
6356.65 |
1615.83 |
| 2018 |
449.54 |
2776.20 |
2661.02 |
779.72 |
6387.07 |
1567.94 |
| 2019 |
449.96 |
2807.49 |
2576.62 |
800.51 |
6569.64 |
1623.28 |
| 2020 |
416.46 |
2873.06 |
2083.81 |
764.06 |
6239.64 |
1658.07 |
| 2021 |
426.06 |
2851.21 |
1684.95 |
746.69 |
6258.57 |
1790.11 |
| 2022 |
431.90 |
3014.04 |
1487.63 |
533.43 |
6271.44 |
1837.32 |
| 2023 |
436.67 |
3011.18 |
999.19 |
439.90 |
6236.20 |
1779.44 |
Wind and solar capacity continues to grow
Total generation capacity (excluding cogeneration) increased by 2.2% (210 MW) to 9,931 MW in 2023. This was mainly due to the continued strong growth in solar capacity which increased 42.1% (110 MW) to 372 MW in 2023. While the growth was mainly in distributed capacity, the country’s first utility-scale solar farm also became operational in 2023, adding 33 MW to capacity. Wind capacity also increased by 10.4% (99 MW) to 1,045 MW total capacity with the Kaiwera Downs Stage 1 and Harapaki wind farms coming online. All other plant types remained unchanged for the year.
Figure 8. Operational capacities by plant type (excluding Hydro) – 1990 to 2023 (GWh)
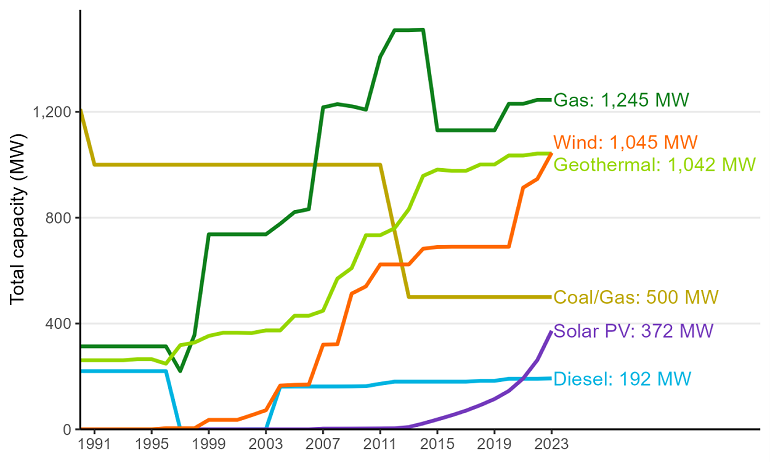
Note: Solar includes both utility-scale and distributed capacity
View chart data for figure 8
Table: Operational capacities by plant type (excluding Hydro) from 1990 to 2023 (Gigawatt hours)
| Year |
Hydro |
Geothermal |
Biogas |
Wind |
Solar PV |
Diesel |
Coal/gas |
Gas |
Other thermal |
| 1990 |
4760.22 |
261 |
3.54 |
|
|
220 |
1210 |
313.5 |
1090 |
| 1991 |
4760.22 |
261 |
7.00 |
|
|
220 |
1000 |
313.5 |
1090 |
| 1992 |
5192.22 |
261 |
7.09 |
|
|
220 |
1000 |
313.5 |
850 |
| 1993 |
5192.22 |
261 |
7.09 |
0.23 |
|
220 |
1000 |
313.5 |
850 |
| 1994 |
5192.22 |
265 |
7.09 |
0.23 |
|
220 |
1000 |
313.5 |
850 |
| 1995 |
5192.22 |
265 |
8.21 |
0.23 |
|
220 |
1000 |
313.5 |
850 |
| 1996 |
5192.22 |
248 |
11.00 |
4.08 |
|
220 |
1000 |
313.5 |
600 |
| 1997 |
5192.22 |
318 |
11.00 |
4.08 |
|
0.33 |
1000 |
220 |
600 |
| 1998 |
5192.22 |
328 |
11.00 |
4.08 |
|
0.33 |
1000 |
357 |
480 |
| 1999 |
5199.22 |
353 |
11.00 |
35.76 |
|
0.33 |
1000 |
737 |
440 |
| 2000 |
5202.22 |
365 |
11.00 |
35.76 |
|
0.33 |
1000 |
737 |
440 |
| 2001 |
5202.22 |
365 |
11.00 |
35.76 |
|
0.33 |
1000 |
737 |
440 |
| 2002 |
5364.77 |
363.80 |
14.08 |
53.43 |
|
0.60 |
1000 |
737 |
440 |
| 2003 |
5365.22 |
373.80 |
21.53 |
72.23 |
|
0.60 |
1000 |
737 |
440 |
| 2004 |
5366.265 |
373.80 |
22.43 |
165.53 |
|
161.62 |
1000 |
777 |
440 |
| 2005 |
5366.715 |
429.20 |
22.43 |
168.03 |
|
161.94 |
1000 |
821 |
330 |
| 2006 |
5366.49 |
429.20 |
23.23 |
169.03 |
|
161.94 |
1000 |
831.9 |
330 |
| 2007 |
5366.97 |
448.20 |
24.78 |
320.03 |
2.73 |
161.94 |
1000 |
1216.9 |
330 |
| 2008 |
5389.64 |
569.70 |
26.78 |
321.53 |
2.77 |
162.04 |
1000 |
1229.02 |
100 |
| 2009 |
5337.6 |
609.30 |
29.86 |
512.88 |
2.87 |
162.33 |
1000 |
1221.02 |
|
| 2010 |
5332.25 |
733.70 |
30.08 |
540.38 |
3.07 |
163.13 |
1000 |
1208.22 |
|
| 2011 |
5407.225 |
733.70 |
32.16 |
623.13 |
3.30 |
172.13 |
1000 |
1408.22 |
|
| 2012 |
5421.2 |
759.70 |
32.16 |
623.13 |
3.86 |
180.17 |
750 |
1508.22 |
|
| 2013 |
5435.2 |
831.90 |
32.16 |
623.13 |
8.58 |
180.17 |
500 |
1508.22 |
|
| 2014 |
5435.1 |
957.90 |
36.06 |
682.48 |
22.05 |
180.17 |
500 |
1510.22 |
|
| 2015 |
5435.1 |
981.71 |
37.08 |
689.05 |
37.25 |
180.17 |
500 |
1130.22 |
|
| 2016 |
5435.1 |
976.91 |
33.46 |
689.95 |
53.06 |
180.14 |
500 |
1130.22 |
|
| 2017 |
5435.1 |
976.91 |
32.54 |
689.95 |
70.62 |
180.14 |
500 |
1130.22 |
|
| 2018 |
5435.1 |
1000.91 |
32.54 |
689.95 |
91.31 |
183.14 |
500 |
1130.22 |
|
| 2019 |
5443.1 |
1000.91 |
32.54 |
689.95 |
114.56 |
183.14 |
500 |
1130.22 |
|
| 2020 |
5442.455 |
1035.01 |
32.60 |
689.95 |
145.13 |
191.14 |
500 |
1230.22 |
|
| 2021 |
5442.455 |
1035.01 |
32.60 |
913.25 |
191.93 |
191.14 |
500 |
1230.22 |
|
| 2022 |
5501.255 |
1042.10 |
32.60 |
946.45 |
262.04 |
191.14 |
500 |
1245.22 |
|
| 2023 |
5501.255 |
1042.10 |
32.60 |
1045.25 |
372.26 |
192.50 |
500 |
1245.22 |
|