December 2016 Update |
Employment Levels
|
Forecast Changes
|
Forecast % Changes
|
3-Digit ANZSCO Occupational Groups |
2016 |
2021 |
2026 |
2016-21 |
2021-26 |
2016-26 |
2016-21 |
2021-26 |
2016-26 |
111 Chief Executives, General Managers and Legislators |
89,278 |
103,935 |
114,802 |
14,657 |
10,868 |
25,524 |
3.1% |
2.0% |
2.5% |
121 Farmers and Farm Managers |
61,706 |
55,292 |
46,774 |
- 6,414 |
- 8,518 |
- 14,932 |
-2.2% |
-3.3% |
-2.7% |
131 Advertising, Public Relations and Sales Managers |
40,150 |
50,447 |
60,488 |
10,297 |
10,041 |
20,338 |
4.7% |
3.7% |
4.2% |
132 Business Administration Managers |
72,022 |
88,209 |
103,230 |
16,187 |
15,022 |
31,209 |
4.1% |
3.2% |
3.7% |
133 Construction, Distribution and Production Managers |
60,582 |
66,799 |
67,018 |
6,217 |
219 |
6,436 |
2.0% |
0.1% |
1.0% |
134 Education, Health and Welfare Services Managers |
16,652 |
19,744 |
22,945 |
3,092 |
3,201 |
6,293 |
3.5% |
3.1% |
3.3% |
135 ICT Managers |
8,307 |
10,572 |
12,821 |
2,265 |
2,249 |
4,513 |
4.9% |
3.9% |
4.4% |
139 Miscellaneous Specialist Managers |
11,219 |
13,734 |
16,175 |
2,515 |
2,441 |
4,956 |
4.1% |
3.3% |
3.7% |
141 Accommodation and Hospitality Managers |
24,926 |
28,690 |
31,645 |
3,765 |
2,955 |
6,719 |
2.9% |
2.0% |
2.4% |
142 Retail Managers |
39,667 |
46,045 |
49,969 |
6,379 |
3,924 |
10,303 |
3.0% |
1.6% |
2.3% |
149 Miscellaneous Hospitality, Retail and Service Managers |
21,009 |
25,616 |
29,860 |
4,607 |
4,244 |
8,851 |
4.0% |
3.1% |
3.6% |
211 Arts Professionals |
9,301 |
11,273 |
12,597 |
1,972 |
1,324 |
3,296 |
3.9% |
2.2% |
3.1% |
212 Media Professionals |
11,888 |
14,092 |
15,678 |
2,205 |
1,586 |
3,790 |
3.5% |
2.2% |
2.8% |
221 Accountants, Auditors and Company Secretaries |
34,701 |
41,915 |
48,243 |
7,214 |
6,328 |
13,543 |
3.8% |
2.9% |
3.3% |
222 Financial Brokers and Dealers, and Investment Advisers |
11,267 |
11,850 |
11,731 |
583 |
- 118 |
464 |
1.0% |
-0.2% |
0.4% |
223 Human Resource and Training Professionals |
13,561 |
15,754 |
17,429 |
2,194 |
1,674 |
3,868 |
3.0% |
2.0% |
2.5% |
224 Information and Organisation Professionals |
36,366 |
42,186 |
46,606 |
5,821 |
4,420 |
10,241 |
3.0% |
2.0% |
2.5% |
225 Sales, Marketing and Public Relations Professionals |
21,330 |
25,772 |
29,650 |
4,442 |
3,878 |
8,320 |
3.9% |
2.8% |
3.3% |
231 Air and Marine Transport Professionals |
7,120 |
7,495 |
7,301 |
376 |
- 194 |
182 |
1.0% |
-0.5% |
0.3% |
232 Architects, Designers, Planners and Surveyors |
24,526 |
30,596 |
36,278 |
6,070 |
5,682 |
11,752 |
4.5% |
3.5% |
4.0% |
233 Engineering Professionals |
28,740 |
34,531 |
40,236 |
5,791 |
5,705 |
11,496 |
3.7% |
3.1% |
3.4% |
234 Natural and Physical Science Professionals |
16,693 |
19,960 |
23,052 |
3,267 |
3,092 |
6,359 |
3.6% |
2.9% |
3.3% |
241 School Teachers |
105,551 |
116,282 |
125,425 |
10,731 |
9,143 |
19,874 |
2.0% |
1.5% |
1.7% |
242 Tertiary Education Teachers |
18,306 |
18,654 |
18,070 |
348 |
- 583 |
- 236 |
0.4% |
-0.6% |
-0.1% |
249 Miscellaneous Education Professionals |
11,111 |
12,105 |
12,719 |
994 |
614 |
1,608 |
1.7% |
1.0% |
1.4% |
251 Health Diagnostic and Promotion Professionals |
13,644 |
16,542 |
19,383 |
2,898 |
2,841 |
5,738 |
3.9% |
3.2% |
3.6% |
252 Health Therapy Professionals |
14,510 |
16,626 |
18,689 |
2,115 |
2,063 |
4,178 |
2.8% |
2.4% |
2.6% |
253 Medical Practitioners |
17,465 |
19,874 |
22,148 |
2,409 |
2,274 |
4,682 |
2.6% |
2.2% |
2.4% |
254 Midwifery and Nursing Professionals |
54,979 |
60,439 |
64,837 |
5,460 |
4,398 |
9,858 |
1.9% |
1.4% |
1.7% |
261 Business and Systems Analysts, and Programmers |
37,893 |
48,429 |
58,953 |
10,535 |
10,525 |
21,060 |
5.0% |
4.0% |
4.5% |
262 Database and Systems Administrators, and ICT Security Specialists |
7,120 |
8,351 |
9,349 |
1,231 |
998 |
2,229 |
3.2% |
2.3% |
2.8% |
263 ICT Network and Support Professionals |
7,387 |
9,203 |
10,830 |
1,816 |
1,627 |
3,442 |
4.5% |
3.3% |
3.9% |
271 Legal Professionals |
17,385 |
21,829 |
26,077 |
4,444 |
4,247 |
8,691 |
4.7% |
3.6% |
4.1% |
272 Social and Welfare Professionals |
35,892 |
40,972 |
45,075 |
5,080 |
4,103 |
9,183 |
2.7% |
1.9% |
2.3% |
311 Agricultural, Medical and Science Technicians |
15,182 |
16,534 |
17,104 |
1,352 |
570 |
1,922 |
1.7% |
0.7% |
1.2% |
312 Building and Engineering Technicians |
20,633 |
24,146 |
26,578 |
3,513 |
2,432 |
5,946 |
3.2% |
1.9% |
2.6% |
313 ICT and Telecommunications Technicians |
8,782 |
9,212 |
8,938 |
430 |
-274 |
156 |
1.0% |
-0.6% |
0.2% |
321 Automotive Electricians and Mechanics |
21,275 |
21,437 |
21,326 |
162 |
- 110 |
52 |
0.2% |
-0.1% |
0.0% |
322 Fabrication Engineering Trades Workers |
14,494 |
17,193 |
19,663 |
2,699 |
2,470 |
5,169 |
3.5% |
2.7% |
3.1% |
323 Mechanical Engineering Trades Workers |
19,237 |
19,412 |
17,958 |
175 |
- 1,454 |
- 1,279 |
0.2% |
-1.5% |
-0.7% |
324 Panelbeaters, and Vehicle Body Builders, Trimmers and Painters |
5,495 |
5,203 |
4,135 |
- 292 |
- 1,068 |
- 1,360 |
-1.1% |
-4.5% |
-2.8% |
331 Bricklayers, Carpenters and Joiners |
19,025 |
19,800 |
18,164 |
775 |
- 1,636 |
- 862 |
0.8% |
-1.7% |
-0.5% |
332 Floor Finishers and Painting Trades Workers |
14,182 |
17,161 |
18,855 |
2,979 |
1,694 |
4,673 |
3.9% |
1.9% |
2.9% |
333 Glaziers, Plasterers and Tilers |
12,881 |
16,466 |
19,197 |
3,585 |
2,731 |
6,316 |
5.0% |
3.1% |
4.1% |
334 Plumbers |
12,316 |
15,279 |
17,239 |
2,964 |
1,959 |
4,923 |
4.4% |
2.4% |
3.4% |
341 Electricians |
20,022 |
24,798 |
28,341 |
4,777 |
3,543 |
8,320 |
4.4% |
2.7% |
3.5% |
342 Electronics and Telecommunications Trades Workers |
10,997 |
12,109 |
12,019 |
1,112 |
-90 |
1,022 |
1.9% |
-0.1% |
0.9% |
351 Food Trades Workers |
38,282 |
45,660 |
52,757 |
7,378 |
7,097 |
14,475 |
3.6% |
2.9% |
3.3% |
361 Animal Attendants and Trainers, and Shearers |
7,116 |
8,751 |
10,485 |
1,635 |
1,734 |
3,369 |
4.2% |
3.7% |
4.0% |
362 Horticultural Trades Workers |
16,726 |
17,675 |
17,495 |
948 |
- 180 |
768 |
1.1% |
-0.2% |
0.5% |
391 Hairdressers |
11,525 |
12,639 |
13,156 |
1,115 |
517 |
1,632 |
1.9% |
0.8% |
1.3% |
392 Printing Trades Workers |
3,567 |
2,897 |
2,140 |
- 671 |
- 757 |
- 1,427 |
-4.1% |
-5.9% |
-5.0% |
393 Textile, Clothing and Footwear Trades Workers |
2,853 |
3,092 |
3,206 |
239 |
114 |
353 |
1.6% |
0.7% |
1.2% |
394 Wood Trades Workers |
3,616 |
3,704 |
3,426 |
88 |
-278 |
-189 |
0.5% |
-1.5% |
-0.5% |
399 Miscellaneous Technicians and Trades Workers |
13,286 |
15,410 |
16,885 |
2,124 |
1,475 |
3,599 |
3.0% |
1.8% |
2.4% |
411 Health and Welfare Support Workers |
24,939 |
29,117 |
33,257 |
4,178 |
4,139 |
8,317 |
3.1% |
2.7% |
2.9% |
421 Child Carers |
10,479 |
11,306 |
11,602 |
826 |
296 |
1,123 |
1.5% |
0.5% |
1.0% |
422 Education Aides |
15,676 |
16,231 |
16,098 |
555 |
- 133 |
421 |
0.7% |
-0.2% |
0.3% |
423 Personal Carers and Assistants |
51,351 |
53,811 |
54,074 |
2,460 |
263 |
2,722 |
0.9% |
0.1% |
0.5% |
431 Hospitality Workers |
42,296 |
48,178 |
52,307 |
5,882 |
4,129 |
10,012 |
2.6% |
1.7% |
2.1% |
441 Defence Force Members, Fire Fighters and Police |
21,532 |
25,618 |
28,964 |
4,087 |
3,345 |
7,432 |
3.5% |
2.5% |
3.0% |
442 Prison and Security Officers |
14,114 |
17,305 |
20,137 |
3,191 |
2,833 |
6,024 |
4.2% |
3.1% |
3.6% |
451 Personal Service and Travel Workers |
18,007 |
18,960 |
18,197 |
953 |
-763 |
190 |
1.0% |
-0.8% |
0.1% |
452 Sports and Fitness Workers |
18,082 |
22,134 |
25,996 |
4,051 |
3,862 |
7,913 |
4.1% |
3.3% |
3.7% |
511 Contract, Program and Project Administrators |
25,304 |
31,308 |
36,960 |
6,003 |
5,653 |
11,656 |
4.3% |
3.4% |
3.9% |
512 Office and Practice Managers |
45,748 |
59,433 |
73,682 |
13,685 |
14,249 |
27,934 |
5.4% |
4.4% |
4.9% |
521 Personal Assistants and Secretaries |
16,203 |
11,465 |
6,498 |
- 4,739 |
- 4,966 |
- 9,705 |
-6.7% |
-10.7% |
-8.7% |
531 General Clerks |
40,833 |
33,580 |
19,534 |
- 7,253 |
- 14,046 |
- 21,298 |
-3.8% |
-10.3% |
-7.1% |
532 Keyboard Operators |
3,059 |
1,889 |
1,121 |
- 1,170 |
- 768 |
- 1,938 |
-9.2% |
-9.9% |
-9.6% |
541 Call or Contact Centre Information Clerks |
4,818 |
4,515 |
3,642 |
- 303 |
- 873 |
- 1,177 |
-1.3% |
-4.2% |
-2.8% |
542 Receptionists |
29,497 |
30,942 |
31,289 |
1,445 |
347 |
1,792 |
1.0% |
0.2% |
0.6% |
551 Accounting Clerks and Bookkeepers |
28,054 |
30,688 |
31,370 |
2,634 |
682 |
3,316 |
1.8% |
0.4% |
1.1% |
552 Financial and Insurance Clerks |
12,395 |
11,322 |
9,616 |
- 1,073 |
- 1,706 |
- 2,779 |
-1.8% |
-3.2% |
-2.5% |
561 Clerical and Office Support Workers |
17,662 |
19,030 |
20,346 |
1,368 |
1,316 |
2,685 |
1.5% |
1.3% |
1.4% |
591 Logistics Clerks |
20,151 |
22,595 |
23,885 |
2,444 |
1,290 |
3,734 |
2.3% |
1.1% |
1.7% |
599 Miscellaneous Clerical and Administrative Workers |
19,490 |
21,741 |
22,808 |
2,251 |
1,066 |
3,318 |
2.2% |
1.0% |
1.6% |
611 Insurance Agents and Sales Representatives |
55,259 |
65,893 |
74,563 |
10,634 |
8,670 |
19,303 |
3.6% |
2.5% |
3.0% |
612 Real Estate Sales Agents |
13,219 |
15,397 |
17,497 |
2,178 |
2,100 |
4,278 |
3.1% |
2.6% |
2.8% |
621 Sales Assistants and Salespersons |
109,037 |
118,330 |
117,255 |
9,293 |
- 1,075 |
8,218 |
1.6% |
-0.2% |
0.7% |
631 Checkout Operators and Office Cashiers |
17,068 |
19,011 |
19,316 |
1,943 |
305 |
2,248 |
2.2% |
0.3% |
1.2% |
639 Miscellaneous Sales Support Workers |
8,784 |
9,190 |
9,287 |
406 |
97 |
502 |
0.9% |
0.2% |
0.6% |
711 Machine Operators |
24,789 |
27,371 |
28,773 |
2,582 |
1,402 |
3,984 |
2.0% |
1.0% |
1.5% |
712 Stationary Plant Operators |
8,787 |
7,693 |
7,421 |
- 1,094 |
- 272 |
- 1,365 |
-2.6% |
-0.7% |
-1.7% |
721 Mobile Plant Operators |
21,689 |
22,953 |
22,461 |
1,264 |
- 492 |
772 |
1.1% |
-0.4% |
0.4% |
731 Automobile, Bus and Rail Drivers |
15,555 |
18,931 |
21,621 |
3,376 |
2,690 |
6,067 |
4.0% |
2.7% |
3.3% |
732 Delivery Drivers |
5,234 |
6,303 |
7,034 |
1,069 |
731 |
1,800 |
3.8% |
2.2% |
3.0% |
733 Truck Drivers |
29,496 |
31,773 |
31,539 |
2,277 |
- 234 |
2,043 |
1.5% |
-0.1% |
0.7% |
741 Storepersons |
20,402 |
23,190 |
24,972 |
2,788 |
1,782 |
4,570 |
2.6% |
1.5% |
2.0% |
811 Cleaners and Laundry Workers |
42,632 |
41,811 |
38,070 |
- 821 |
- 3,742 |
- 4,563 |
-0.4% |
-1.9% |
-1.1% |
821 Construction and Mining Labourers |
24,159 |
29,031 |
32,512 |
4,871 |
3,482 |
8,353 |
3.7% |
2.3% |
3.0% |
831 Food Process Workers |
27,409 |
28,146 |
28,021 |
736 |
- 124 |
612 |
0.5% |
-0.1% |
0.2% |
832 Packers and Product Assemblers |
15,194 |
15,978 |
16,055 |
785 |
76 |
861 |
1.0% |
0.1% |
0.6% |
839 Miscellaneous Factory Process Workers |
8,983 |
10,216 |
11,046 |
1,233 |
831 |
2,063 |
2.6% |
1.6% |
2.1% |
841 Farm, Forestry and Garden Workers |
51,729 |
52,209 |
51,167 |
480 |
- 1,042 |
- 562 |
0.2% |
-0.4% |
-0.1% |
851 Food Preparation Assistants |
17,464 |
19,600 |
21,038 |
2,137 |
1,437 |
3,574 |
2.3% |
1.4% |
1.9% |
891 Freight Handlers and Shelf Fillers |
7,122 |
8,060 |
8,416 |
938 |
356 |
1,294 |
2.5% |
0.9% |
1.7% |
899 Miscellaneous Labourers |
62,611 |
71,282 |
76,989 |
8,671 |
5,708 |
14,378 |
2.6% |
1.6% |
2.1% |
Totals |
2,360,056 |
2,645,925 |
2,831,588 |
285,869 |
185,663 |
471,532 |
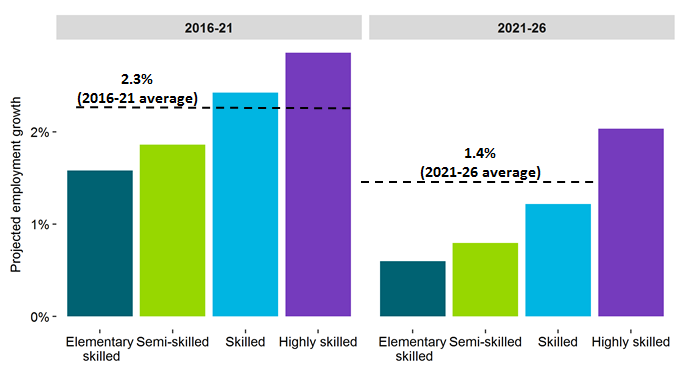
2.31% |
1.37% |
1.84% |
Per Year |
|
|
|
57,174 |
37,133 |
47,153 |
|
|
|