Gas
Natural gas is a naturally occurring mixture of gases, consisting mainly of methane, which can be extracted from the ground in a similar way to crude oil. New Zealand’s natural gas fields are concentrated around and off the coast of the Taranaki region.
On this page
Natural gas is difficult to transport by ship, so New Zealand doesn’t import or export any natural gas: all natural gas produced in New Zealand is used in New Zealand.
While some large users have direct connections to natural gas fields, most users draw natural gas from a network of pipes maintained by Firstgas. As this network does not extend to the South Island, natural gas is exclusively used in the North Island. A subsidiary of Firstgas, Flex Gas, operates the New Zealand’s only natural gas storage facility at Ahuroa.
The largest user of natural gas in New Zealand is Methanex, which uses natural gas to produce methanol. Industrial use of natural gas accounts for approximately 60% of all use in New Zealand, while 30% is used in electricity generation, cogeneration, and other transformation activities. The remaining 10% of gas use covers household use as well as use in schools, hospitals, and other non-industrial settings.
Gas production and consumption up slightly in 2023
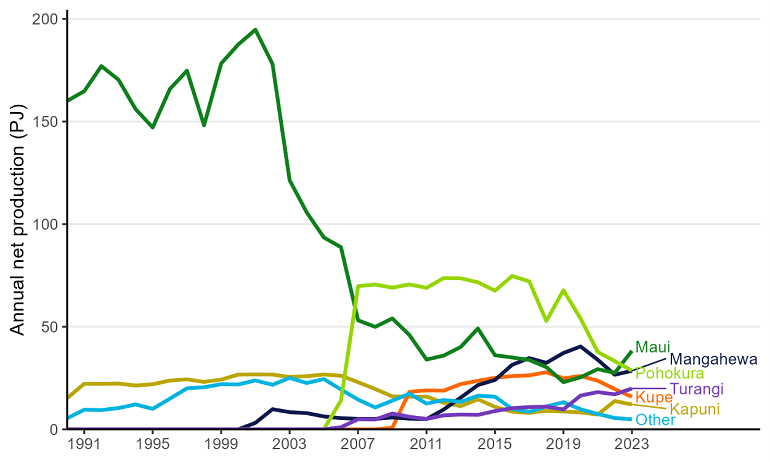
Net production of natural gas for 2023 was 148.1 petajoules (PJ), an increase of 3% (4.8 PJ) on 2022 production levels. This increase was driven by higher production from the Maui field (up 11.4 PJ on 2022 production) following a drilling campaign in early 2023. There were also increases in production from Turangi (2.8 PJ) and Mangahewa (1.9 PJ) fields. Production at Kupe and Pohokura fields continued to decline into 2023, decreasing by 5.3 PJ and 4.5 PJ respectively.
Figure 13. Gas production – 1990 to 2023 (PJ)
View chart data for figure 13
Electricity generation and industrial use lead to higher gas use
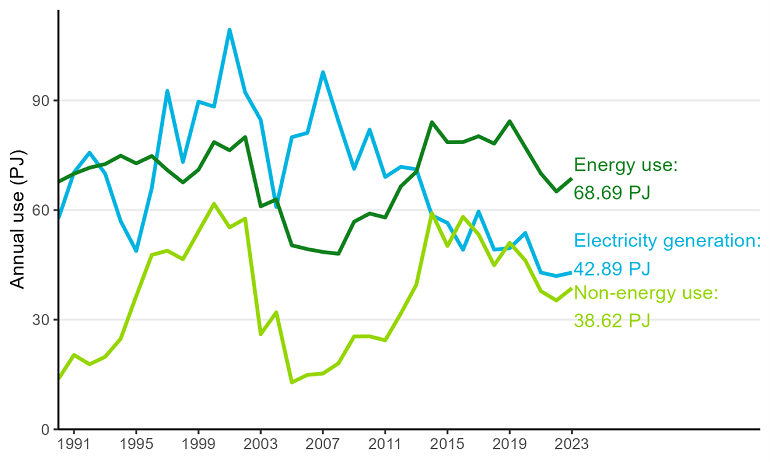
Total natural gas use (covering electricity generation, non-energy use, and consumption) for 2023 totalled 154.08 PJ, an increase of 5% (7.30 PJ) on 2022 levels. This increase was primarily driven by non-energy use of gas (up 3.36 PJ) and consumption in the food processing sector (up 3.11 PJ). Non-energy use includes the use of natural gas as a feedstock, such as the production of methanol or urea.
Figure 14. Gas end usage – 1990 to 2023 (PJ)
View chart data for figure 14
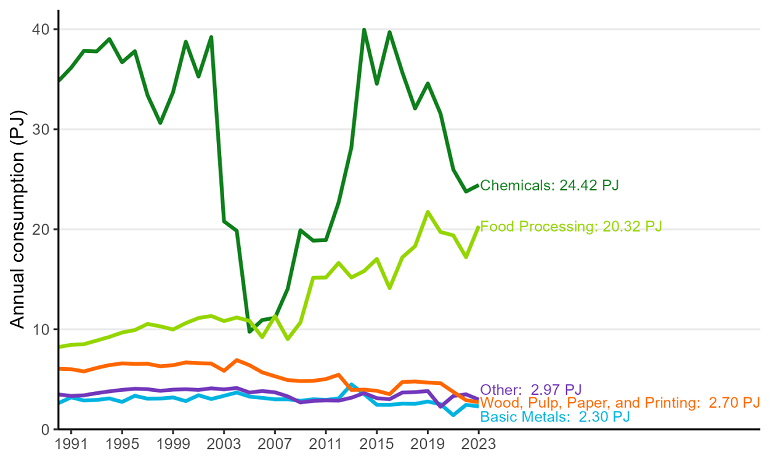
Gas use in the wood processing subsector continued to fall with a 7% (0.2 PJ) drop to 2.7 PJ in 2023. Gas usage in the wood, pulp, paper, and printing sector has fallen 42% (1.98 PJ) over the last 5 years.
Figure 15. Industrial gas consumption by subsector – 1990 to 2023 (PJ)
View chart data for figure 15
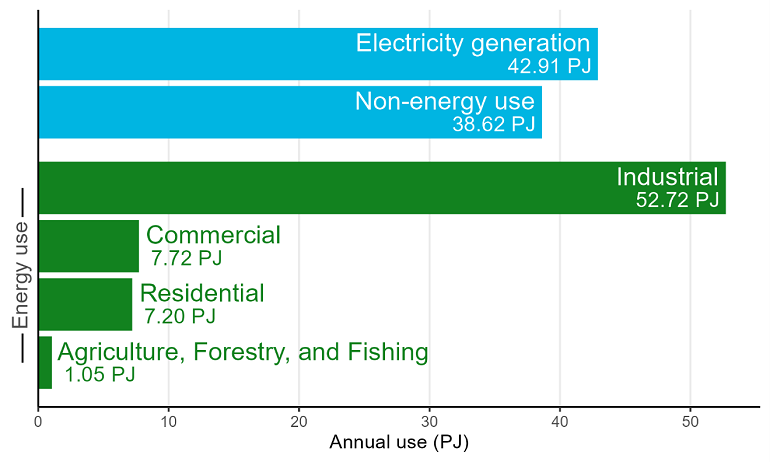
Of all the gas used in New Zealand in 2023, the majority was used by the industrial sector – either being burnt for heat (35% of all use) or being used as a feedstock (26% ). Around 29% of gas use was for electricity generation, and the remaining 10% represented use by households, schools, hospitals, and other businesses.
Figure 16. Gas use by type and sector – 2023 (PJ)
View chart data for figure 16
Natural gas reserves continue to fall
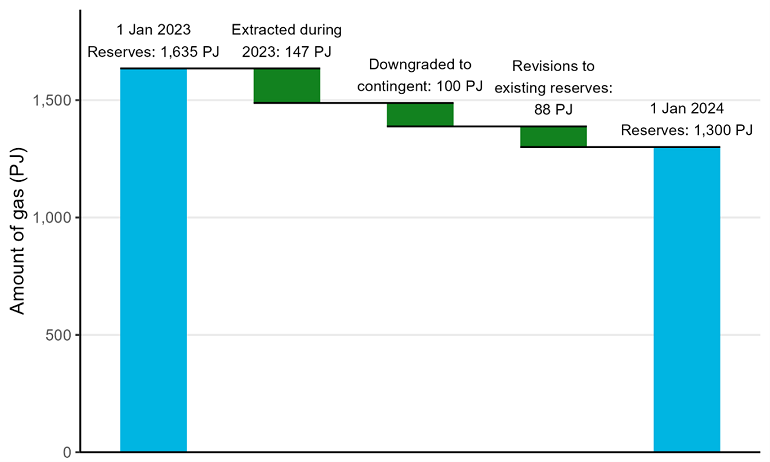
As at January 1st 2024, New Zealand’s gas reserves dropped 20% (335 PJ) to 1,300 PJ. Of this decrease:
- 44% (147 PJ) was due to gas extraction and use in the 2023 calendar year
- 30% (100 PJ) was due to reserves downgraded to contingent resources
- 26% (88 PJ) was due to reserves being removed altogether because operators now believe the relevant fields hold less gas than previously thought.
Remaining reserves are expected to decrease each year, as field operators extract oil and gas for use. However, the past 2 releases have shown significant downward revisions in gas reserves data. More information on petroleum reserves and the underlying data can be accessed on the MBIE website.
*Contingent resources refer to the oil and natural gas which field operators know remain ‘in the ground’ at their fields, but which they do not expect to extract in the future (because, for example, it would be too expensive, or they lack the technical facilities to do so).
Figure 17. Proven plus probable (2P) gas reserves figures – 2019 to 2023
View chart data for figure 17
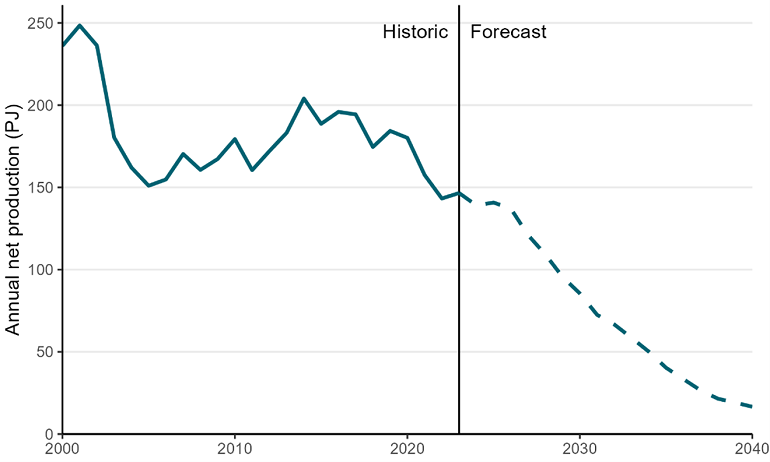
Additionally, field operators' production profiles indicate that gas deliverability is likely to dip below recent demand. Production profiles show what field operators are expecting to produce in future years on an annual basis. As at January 1st 2024, operators are expecting to produce 139 PJ of natural gas in the 2024 calendar year, which is 11 PJ less than what has been used in recent years. This was a significant change from previous projections, in which it was expected that deliverability would fall below demand in 2027. Deliverability is expected to stay level around 140 PJ per year until 2026, before declining from 2027 onwards.
Figure 18. Historic gas net production and forecast deliverability based on reserves data – 2000 to 2040 (PJ)
View chart data for figure 18

