Oil
New Zealand is a producer of crude oil, with fields concentrated around Taranaki. However, the crude oil produced in New Zealand has historically been almost entirely exported. Since the closure of New Zealand’s only oil refinery at Marsden Point, all domestic petroleum needs are served by imports of refined products such as petrol, diesel, and jet fuel.
On this page I tēnei whārangi
‘Oil’ is a term that covers a range of different products; from crude oil extracted from oil fields, to refined fuels like petrol and diesel, and non-fuel products like bitumen.
Crude oil produced in New Zealand has historically been almost entirely exported, as it is both lighter (that is, containing smaller, shorter-chain hydrocarbons) and ‘sweeter’ (that is, containing less sulphur) than was ideal for domestic refining.
New Zealand’s domestic petroleum needs are served by imports, either of crude oil (which were then refined at the country’s only oil refinery at Marsden Point) or of refined products (such as petrol, diesel, and jet fuel).
The country’s only oil refinery at Marsden Point stopped refining operations on 31 March 2022, transitioning to operating as a dedicated fuel import terminal. As a result, importers switched from importing a mix of crude oil and refined products, to only importing refined products.
Singapore was the main source of refined oil products in 2023
Since the closure of Marsden Point Oil Refinery in 2022, the mix of New Zealand’s oil imports has shifted focussing more on markets for refined products. In 2023, Singapore remained the largest source of oil imports (3,595 kt imported in 2023), followed by Korea (1,717 kt) and Malaysia (904 kt).
Prior to the closure of the refinery, the United Arab Emirates had been NZ’s largest source of oil imports as this is where the majority of crude oil for processing in the refinery was sourced from.
Energy products that are either extracted or captured directly from natural resources are termed primary products.
Energy products produced from primary commodities are termed secondary products. When discussing oil, these products are sometimes termed ‘refined products’ as they are the product of oil refining.
Domestic oil production increases
New Zealand’s indigenous production of oil can be split into 2 broad categories:
- crude oil (which includes condensates, naphtha, and natural gas liquids)
- liquified petroleum gas (LPG).
Crude oil is exclusively exported, while LPG is mainly used domestically.
In 2023, indigenous production of crude oil increased by 7% (2.85 PJ) to 44.80 petajoules (PJ). This was a slight reversal on the steady decline over the last 5 years and was driven by increased production from Maui (up 2.24 PJ), Maari (up 2.04 PJ), and Cheal (up 0.92 PJ) fields. Production of LPG fell slightly, down 7% (0.58 PJ) on 2022 to 7.15 PJ.
Figure 19. Production and exports of crude oil – 1990 to 2023 (PJ)
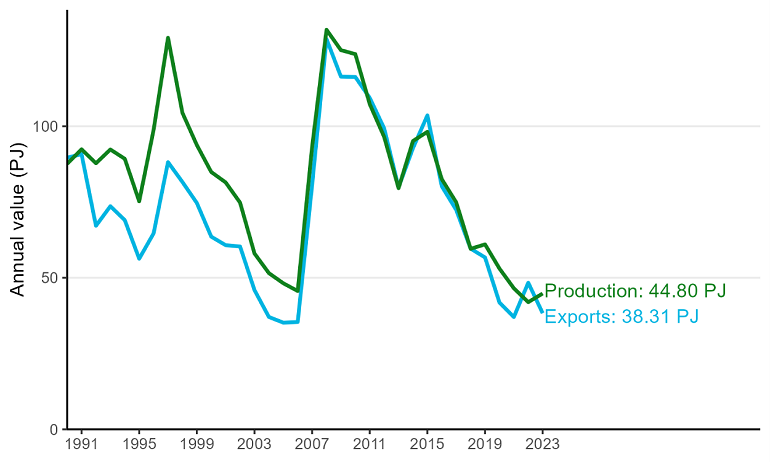
View chart data for figure 19
Aviation fuel imports and consumption continues strong recovery
With the Marsden Point Oil Refinery ceasing refinery operations, New Zealand’s oil imports switched from being a mixture of crude oil and refined products, to only being refined products. As a result, there were increases in imports of all refined petroleum products, while crude oil imports fell to zero. Imports of both refined petrol and diesel increased in 2023, up 19% and 15% respectively.
Combined with the continuing recovery in travel activity following the coronavirus (COVID-19) pandemic, this resulted in aviation fuel imports doubling, up 102% (29.70 PJ) to 58.71 PJ.
Total consumption of aviation fuels (covering both domestic and international transport) increased by 58% (21.07 PJ) to 57.59 PJ in 2023. While this hasn’t returned to levels seen prior to the coronavirus (COVID-19) pandemic, it continues to grow with domestic use of aviation fuel in 2023 up 24% (3.54 PJ) on 2019 levels.
Figure 20. Domestic and international aviation fuel consumption – 1990 to 2023 (PJ)
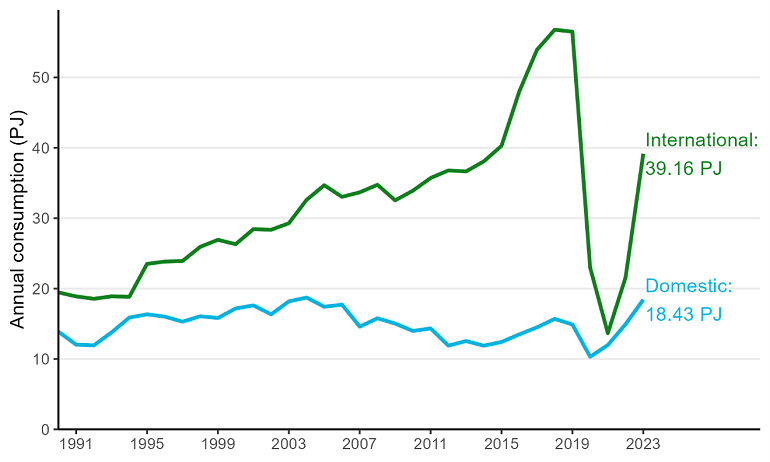
View chart data for figure 20
Petrol consumption for transport still below pre-pandemic levels
Almost 3 quarters of oil consumed in New Zealand is used for domestic transport. This category includes land transport (road and rail), domestic aviation, and domestic water-based transport (eg ferries).
Petrol consumption for land transport increased by 2% (1.51 PJ) to 83.93 PJ in 2023. This was still 14% lower than in 2019, and 9% lower than 10 years ago. Diesel use for land transport also increased by 2% (1.77 PJ) to 103.34 PJ, though this was 9% higher than in 2019.
Figure 21. Petrol and diesel consumption for land transport – 1990 to 2023
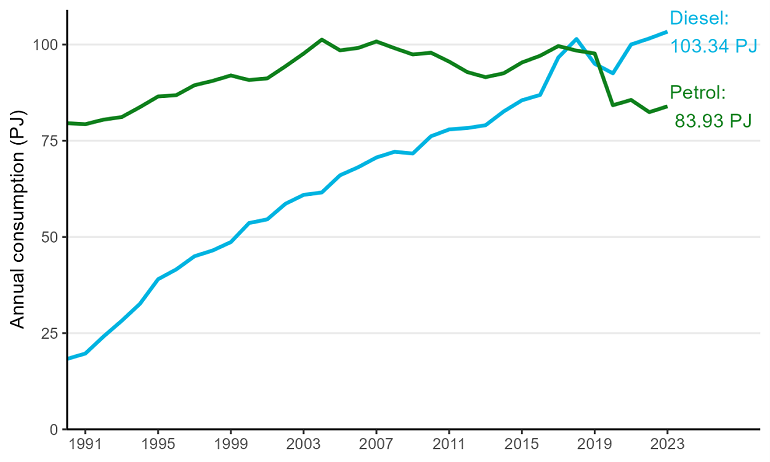
View chart data from figure 21
Consumption of petrol for uses other than transport is mostly concentrated in the residential sector. Petrol use in this sector has remained stable over the last five years, increasing by 7% (0.96 PJ) over that period. This consumption rose by 2% (0.26 PJ) in 2023 to 14.13 PJ.
Compared to 2022, premium and regular petrol prices were relatively stable throughout most of 2023, starting the year at 248 cents per litre and 233 cents per litre respectively. The reintroduction of the fuel excise duty* in July 2023 saw prices briefly reach 319 cents per litre for premium and 304 cents per litre for regular. Petrol prices dropped from that level to end the year at an average 280 cents per litre and 263 cents per litre in the final week of 2023. Diesel prices followed a similar trend, starting at 226 cents per litre for the first week of the year before falling to 208 cents per litre for the final week of 2023.
*These were temporarily removed in response to high oil prices seen following the Russian invasion of Ukraine.
Figure 22. Monthly median retail fuel prices – 2019 to 2023
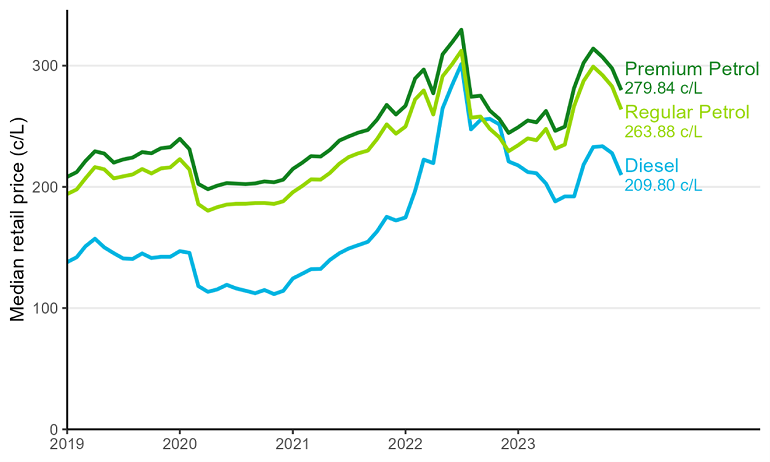
Median monthly prices are shown for smoother trend illustration.
View chart data for figure 22