Coal
New Zealand has in-ground coal resources of more than 15 billion tonnes, of which 80% are lignite in the South Island. There are also substantial resources of sub-bituminous coal in both islands, and a lesser amount of high-quality bituminous coal, mainly on the West Coast of the South Island.
On this page
Sub-bituminous and bituminous in-ground resources are around 4 billion tonnes, but economic reserves are much smaller.
New Zealand's coal industry can be divided into three distinct geological areas.
- In the North Island, coal production is centred in the Waikato region where large coalfields like Maramarua and Rotowaro produce sub-bituminous coal. This coal is excellent for heating and electricity generation, although its quality is generally not high enough for it to be exported for use in the production of iron and steel. The main consumers of this coal are Genesis' Huntly Power Station and the Glenbrook steel mill. Unlike most steel mills around the world, the Glenbrook mill uses sub-bituminous coal due to the unique processes used at the facility.
- Coal extracted on the West Coast of the South Island is mostly bituminous coal, along with some sub-bituminous. The bituminous coal is generally exported for use in the production of iron and steel.
- The rest of the South Island tends to produce either sub-bituminous coal, or the even lower-energy lignite primarily used for industrial process heat.
Most of the imported coal is sub-bituminous coal, used for electricity generation and steel production.
Coal supply and use continue to trend down
New Zealand imports most of the coal that is uses domestically, while coal mined in New Zealand supplies both the domestic and export markets.
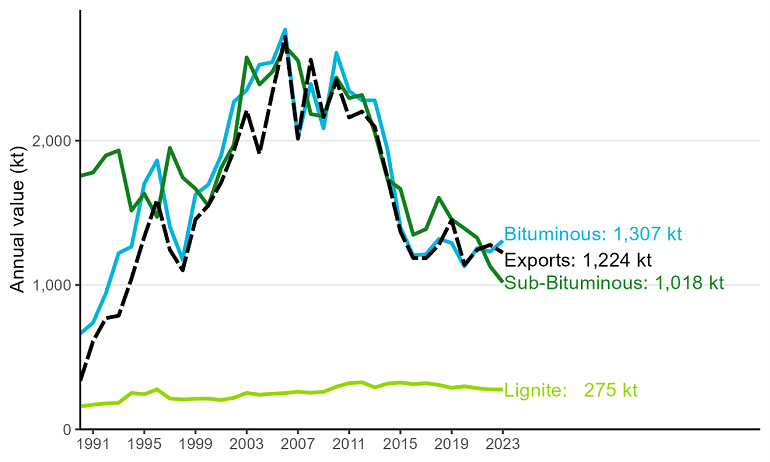
Domestic coal production continued to decline, with a 1.4% (37 kilotonne) decrease to 2,600 kilotonnes (kt) in 2023. At the end of 2023, 13 mines were operating in New Zealand compared to 18 at the end of 2020. 2023’s coal exports decreased by 4% (54 kt) on 2022 figures, totalling 1,224 kt in 2023. Both production and exports have steadily fallen over the past decade, with a small uptick between 2017 and 2019.
Figure 10. Coal production and exports – 1990 to 2023 (kt)
View chart data for figure 10
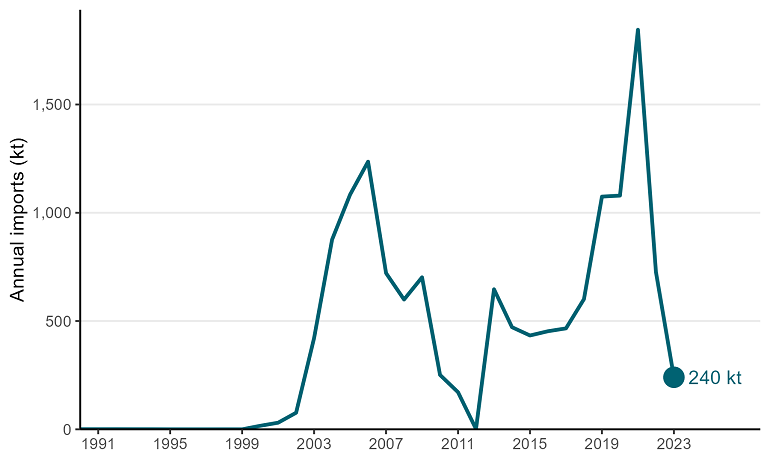
Coal imports have varied in recent years in response to requirements for domestic electricity generation and movements in international coal prices. Coal imports in 2021 reached their highest level on record and exceeded exports for the first time, as low hydro levels drove an increased demand for coal for electricity generation. Coal imports fell in 2023, down 487 kt (67% ) to 240 kt. Contributing to this was companies drawing on high onshore stock levels, a result of high imports between 2019 and 2022.
Figure 11. Coal imports – 1990 to 2023 (kt)
View chart data for figure 11
Lower levels of consumption and transformation lead to lower coal use
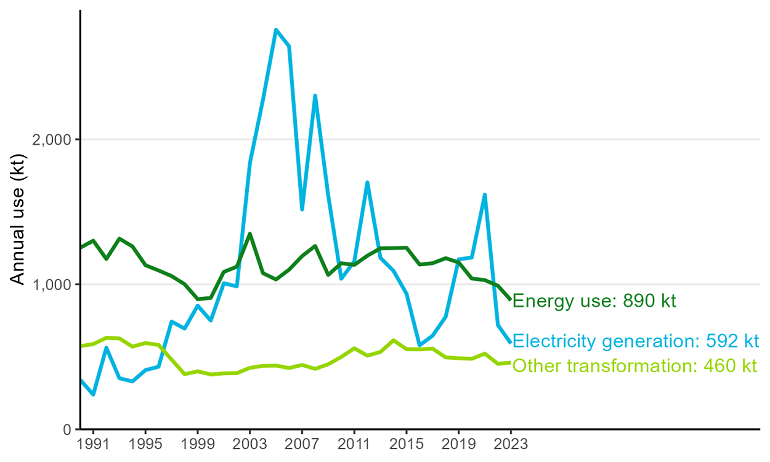
Total coal use (covering electricity generation, and consumption in sectors) fell 10% (219 kt) on 2022 levels to 1,952 kt in 2023. Driving this was reductions in most sectors, with the largest falls seen in the industrial sector (down 102 kt) and in use for electricity generation (down 95 kt). The exceptions were coal use in transformation processes (which includes the use of coal in iron- and steelmaking) and consumption in the agricultural, forestry and fishing sector which were both up slightly.
Figure 12. Coal end use 1990 to 2023 (kt)
View chart data for figure 12