June 2024 summary
On this page
This is the web version of the New Zealand Energy Quarterly June 2024 Summary.
Download the PDF and word versions:
New Zealand Energy Quarterly June 2024 summary [PDF, 401 KB]
New Zealand Energy Quarterly June 2024 summary [DOCX, 944 KB]
Low hydro lake levels drive increase in non-renewable electricity generation
New data from the Ministry of Business Innovation & Employment shows between April and June this year, extra coal and gas were needed to generate enough power for New Zealand homes and businesses.
Low hydro lake levels meant electricity generated from renewable sources dropped to 81.3% of total generation, an 8.6% drop compared to same time last year.
For the first time since June 2021, and despite a 50% increase in wind capacity, coal generated more electricity than wind.
Coal-based electricity generation increased to 883 GWh for the quarter, compared to 144 GWh of generation in the same quarter last year. Electricity generation from natural gas increased 43.9% on the same quarter last year, contributing 10.7% of overall electricity generation for the quarter, but due to limitations in natural gas supply, it wasn't able to fully cover the drop in hydro generation for the quarter. Contributing 7.9% of total generation for the quarter, coal-fired generation was required to support gas-fired generation in making up for the reduction in generation from hydro.
On the supply side, net production of gas was down 19%. Decreasing gas supply resulted in a drop in gas use, with large users responding by continuing to operate at lower levels.
Electricity generation from geothermal was the highest on record for a quarterly basis with 2143 GWh generated, contributing 19.1% of total generation for the quarter.
This record was achieved by the new Tauhara geothermal station near Taupō coming online and supply being at normal levels compared to the same time last year when geothermal generation was lower than usual due to outages at a number of plants.
Increased electricity generation from non-renewable sources saw emissions from electricity generation reach the highest level on a quarterly basis since June 2021 with 1,431 kt CO2-e, representing a 169% increase from the previous June quarter.
Alongside Energy Quarterly, MBIE is also releasing Energy in New Zealand, which compiles data from each Energy Quarterly from 2023, and its regular Oil and Gas statistics, current to July 2024.
Read more information on energy use in New Zealand
Summary charts
Electricity generation from hydro
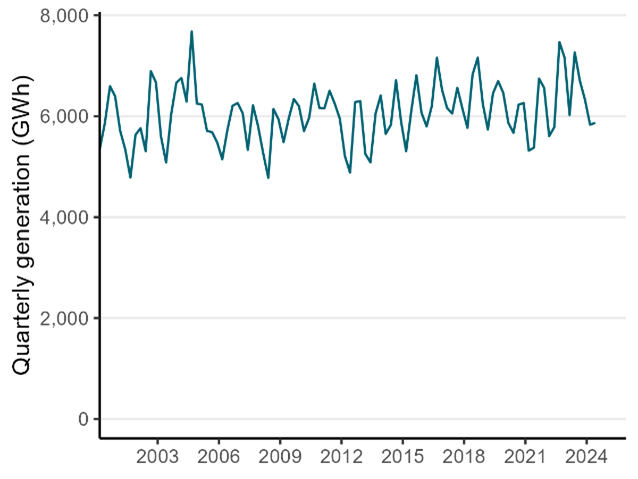
Text description of graph
Electricity generation from coal and wind sources
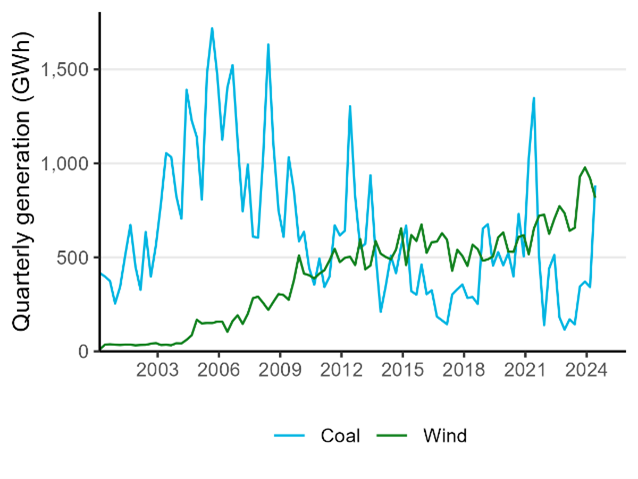
Text description of graph
Natural gas production
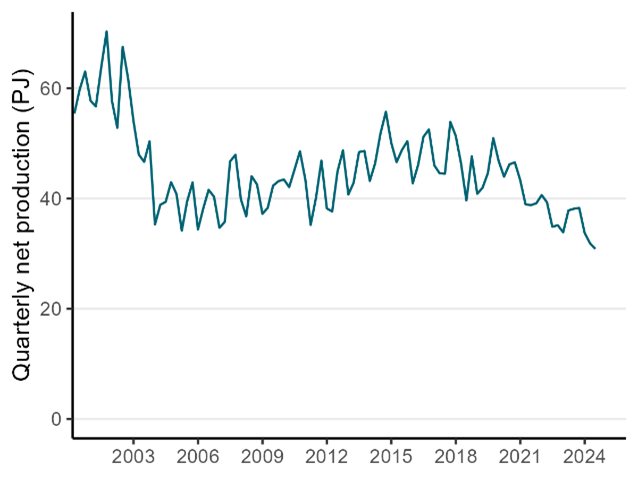
Text description of graph
Electricity generation from geothermal sources
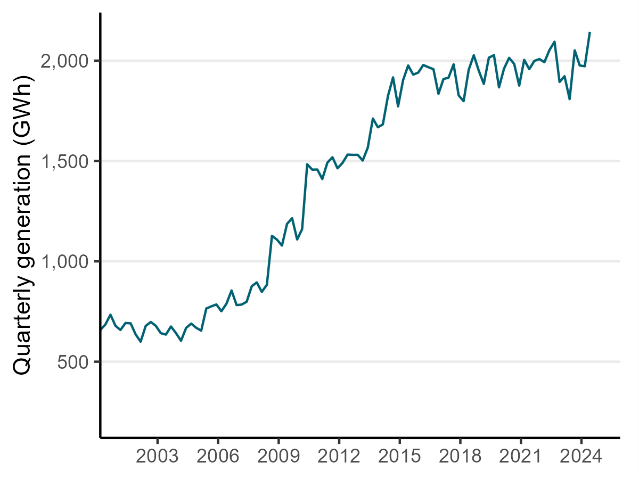
Text description of graph
Electricity generation from renewable vs non-renewable sources
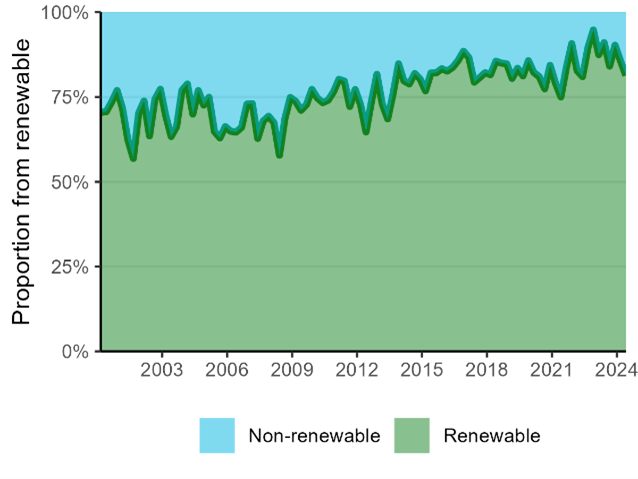
Text description of graph
CO2-e emissions from electricity generation
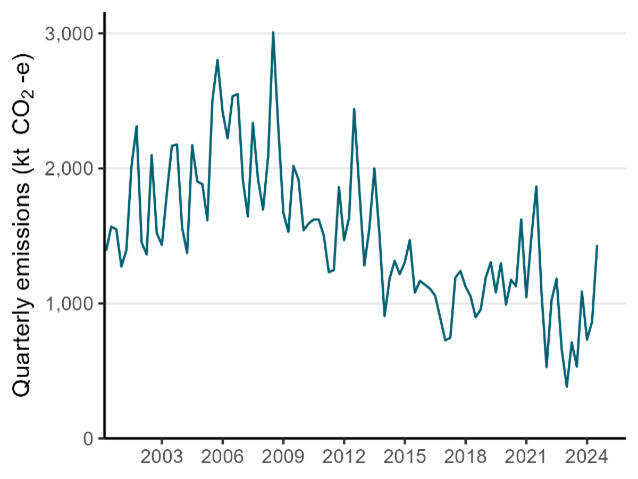
Text description of graph