March 2024 summary
On this page
This is the web version of the New Zealand Energy Quarterly March 2024 Summary.
Download the PDF and word versions:
New Zealand Energy Quarterly March 2024 summary [PDF, 312 KB]
New Zealand Energy Quarterly March 2024 summary [DOCX, 1.1 MB]
Natural gas production continues to decline
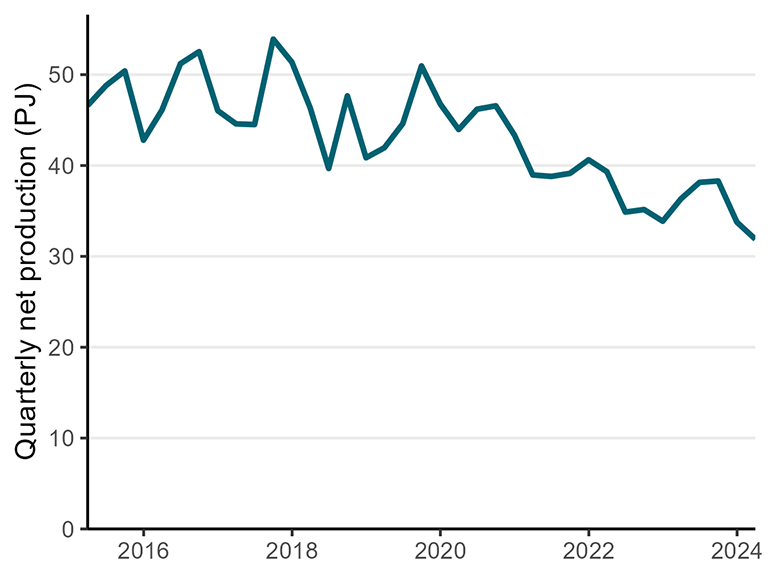
Natural gas net production for the quarter was 31.89 PJ, a 12% decrease on March 2023 and the lowest quarterly net production since March 1985. A planned outage at Pohokura gas field for maintenance in March added to the steady long-term decrease in gas production. The trend is expected to continue into Quarter 2 with Kapuni gas field going offline for planned maintenance in April.
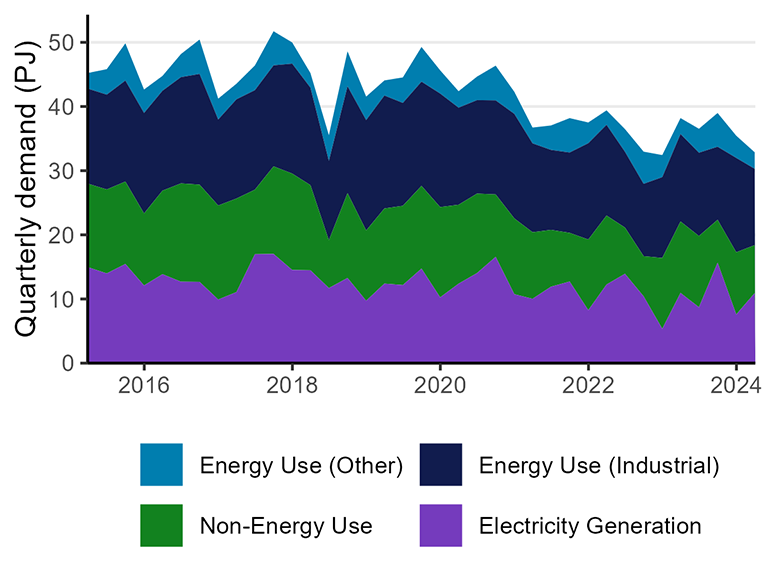
Reduced natural gas production had a direct impact on consumption with a 33% drop in non-energy use compared with March 2023 quarter, and a 31% decrease in energy use in the chemical sector. Driving this fall was Methanex, one of the largest users of gas in New Zealand reducing its production of methanol in response to less available gas supply.
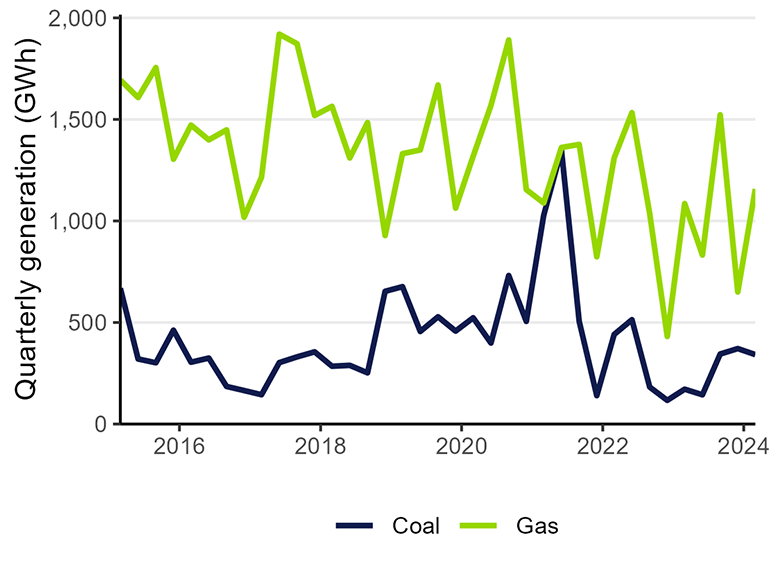
Although the gas-fired Huntly Unit 5 returned to service earlier than scheduled following an unscheduled outage, the lower gas supply led to the need for coal-fired electricity generation to meet demand. Following a dryer summer and below normal rainfall, generation from gas and coal was needed to meet demand for electricity. Compared to the same quarter last year there was a 99% increase in coal for electricity generation.
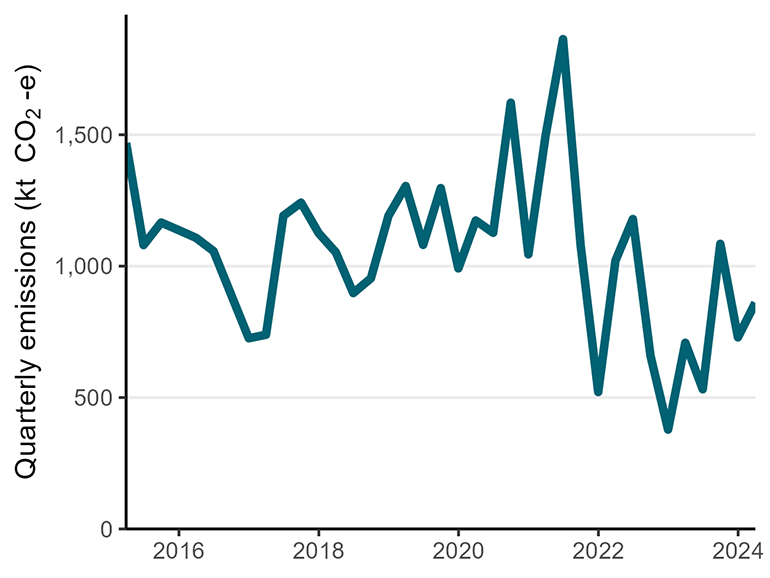
As the share of renewable electricity generation decreased, greenhouse gas emissions from electricity generation increased to 861 kt CO2-e, a 21.5% increase compared with the March 2023 quarter. Other key statistics
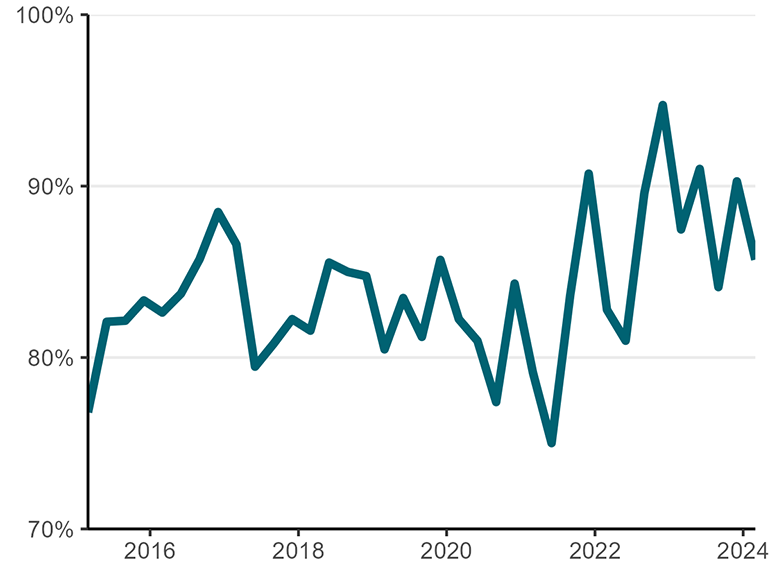
- New solar and wind electricity generation helped offset a 3.2% drop in hydro generation to keep the renewable share high at 85.7% for the past quarter.
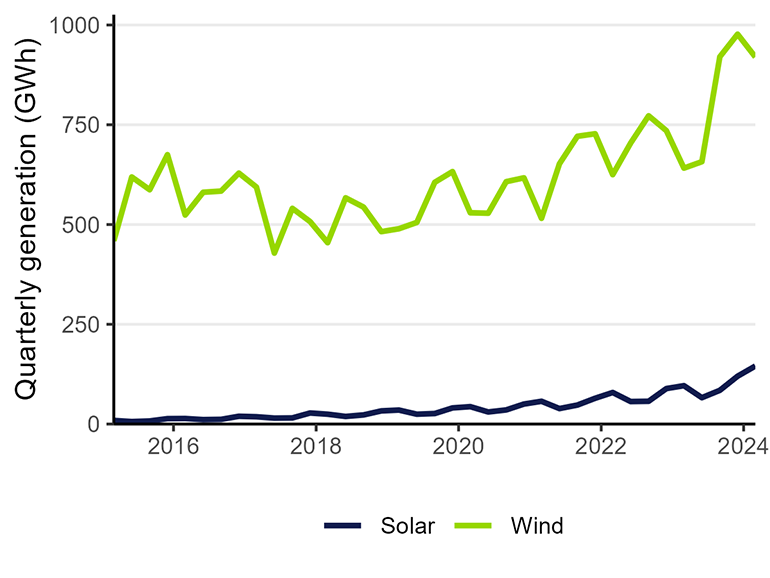
- New capacity from Rangitaiki Solar Farm helped boost solar generation to 145 GWh, a 51.2% increase from March 2023.
- Full commissioning of Turitea Wind Farm helped to increase wind generation with 920 GWh produced, a 43.4% increase.
Read more information on energy use in New Zealand
Summary charts
Electricity generation from renewable sources
Text description of graph
CO2-e emissions from electricity generation
Text description of graph
Electricity generation from solar and wind sources
Text description of graph
Electricity generation from coal and gas
Text description of graph
Natural gas net production
Text description of graph
Natural gas demand
Text description of graph