New Zealand's economic context
Lifting New Zealand’s productivity and economic growth can increase opportunities and prosperity for all New Zealanders.
On this page
I tēnei whārangi
As the Government’s lead micro-economic and business-facing agency, MBIE has many policy and service delivery functions that can affect the economy. We track various indicators to make sure we understand New Zealand’s economic context and the environment we operate in, so we can make changes where they matter.
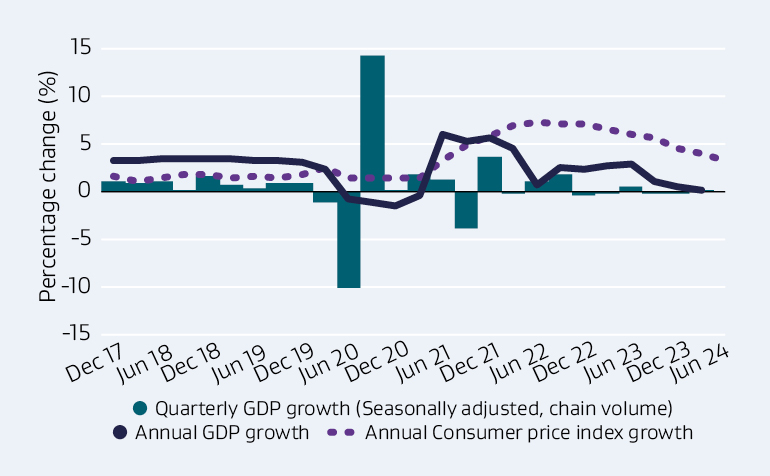
GDP Growth
Economic growth, as measured by real gross domestic product (GDP), was 0.2% over the year to March 2024.
Growth has been modest compared with other small, advanced economies due in part to New Zealand’s high official cash rate in response to persistently high inflation.
Annual headline inflation fell to 3.3% over the year to June 2024, down from a peak 2 years earlier of 7.3%.
Text description for graph - GDP Growth
Mixed bar and line graph depicting quarterly GDP growth, Annual GDP growth, and Annual Consumer price index growth presented 6 monthly.
| Quarter |
Quarterly GDP growth (SA, chain volume) |
Annual GDP growth |
Annual CPI growth |
| Dec-17 |
1 |
3.3 |
1.594399 |
| Mar-18 |
0.8 |
3.4 |
1.1 |
| Jun-18 |
1.1 |
3.5 |
1.5 |
| Sep-18 |
0.2 |
3.5 |
1.901299 |
| Dec-18 |
1.5 |
3.5 |
1.888668 |
| Mar-19 |
0.7 |
3.5 |
1.48368 |
| Jun-19 |
0.3 |
3.3 |
1.674877 |
| Sep-19 |
0.8 |
3.3 |
1.464844 |
| Dec-19 |
0.8 |
3.1 |
1.853659 |
| Mar-20 |
-1.2 |
2.4 |
2.534113 |
| Jun-20 |
-10.1 |
-0.7 |
1.453488 |
| Sep-20 |
14.1 |
-1.1 |
1.443696 |
| Dec-20 |
0.1 |
-1.4 |
1.436782 |
| Mar-21 |
1.8 |
-0.4 |
1.520913 |
| Jun-21 |
1.2 |
6 |
3.342884 |
| Sep-21 |
-3.9 |
5.3 |
4.933586 |
| Dec-21 |
3.5 |
5.6 |
5.949008 |
| Mar-22 |
-0.1 |
4.6 |
6.928839 |
| Jun-22 |
1 |
0.7 |
7.301294 |
| Sep-22 |
1.8 |
2.5 |
7.233273 |
| Dec-22 |
-0.5 |
2.4 |
7.219251 |
| Mar-23 |
-0.3 |
2.7 |
6.654991 |
| Jun-23 |
0.5 |
3 |
6.029285 |
| Sep-23 |
-0.3 |
1.2 |
5.649241 |
| Dec-23 |
-0.1 |
0.6 |
4.655029 |
| Mar-24 |
0.2 |
0.2 |
4.022989 |
| Jun-24 |
|
|
3.330626 |
International trade
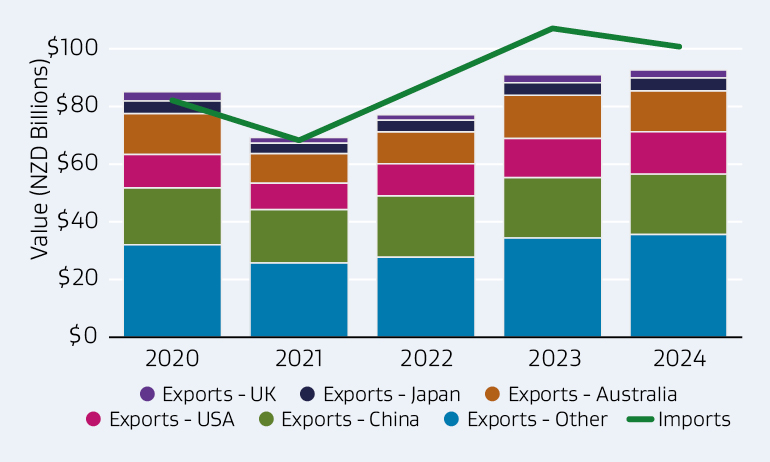
The value of exports continues to rise, with imports down for the year.
The value of exports rose 1.6% from $92 billion in the year ending March 2023 to $93.5 billion in the year ending March 2024. A fall in exports to Australia, China and Japan was offset by a rise in exports to the United States of America, United Kingdom and other countries.
Imports fell 6% over the same period, leading to a narrowing of New Zealand’s trade deficit, from $16.1 billion to $8 billion.
Text description for graph - International trade
Mixed bar and line graph depicting value of export values for the UK, Japan, Australia, USA, China, and other, and imports.
Business environment
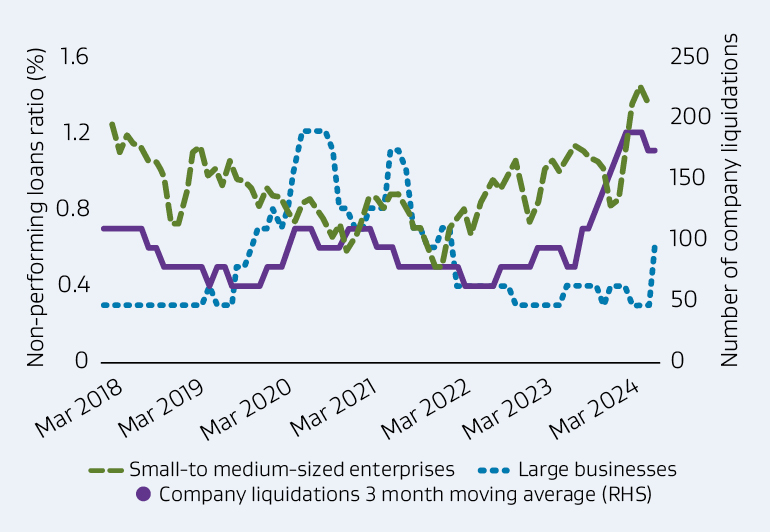
Businesses have been under pressure this year from lower demand and elevated interest rates.
The ratio of non-performing business loans has risen for small to medium enterprises (SMEs) (1.1% as of June 2024), while for large businesses it has remained relatively steady over the year ending June 2024.
The number of company liquidations has risen, with over 2,100 liquidations in 2023/24, a 19.3% increase on the previous year.
Text description for graph - Business environment
Line graph depicting non-performing loans ratio and number of company liquidations for small-to medium-sized enterprises, large businesses, and company liquidations 3 month moving average by year.
| Month |
SMEs |
Large businesses |
Company liquidations |
Company liquidations 3MA (RHS) |
| Mar 2018 |
0.7 |
0.3 |
238 |
|
| Apr 2018 |
0.7 |
0.3 |
151 |
191.33 |
| May 2018 |
0.7 |
0.3 |
185 |
170.67 |
| Jun 2018 |
0.7 |
0.3 |
176 |
183.67 |
| Jul 2018 |
0.7 |
0.3 |
190 |
176.00 |
| Aug 2018 |
0.7 |
0.3 |
162 |
174.33 |
| Sep 2018 |
0.6 |
0.3 |
171 |
162.67 |
| Oct 2018 |
0.6 |
0.3 |
155 |
162.33 |
| Nov 2018 |
0.5 |
0.3 |
161 |
150.00 |
| Dec 2018 |
0.5 |
0.3 |
134 |
112.33 |
| Jan 2019 |
0.5 |
0.3 |
42 |
112.33 |
| Feb 2019 |
0.5 |
0.3 |
161 |
134.33 |
| Mar 2019 |
0.5 |
0.3 |
200 |
170.67 |
| Apr 2019 |
0.5 |
0.3 |
151 |
175.33 |
| May 2019 |
0.4 |
0.4 |
175 |
151.00 |
| Jun 2019 |
0.5 |
0.3 |
127 |
157.33 |
| Jul 2019 |
0.5 |
0.3 |
170 |
142.67 |
| Aug 2019 |
0.4 |
0.3 |
131 |
163.00 |
| Sep 2019 |
0.4 |
0.5 |
188 |
148.00 |
| Oct 2019 |
0.4 |
0.5 |
125 |
147.00 |
| Nov 2019 |
0.4 |
0.6 |
128 |
141.00 |
| Dec 2019 |
0.4 |
0.7 |
170 |
126.67 |
| Jan 2020 |
0.5 |
0.7 |
82 |
141.33 |
| Feb 2020 |
0.5 |
0.8 |
172 |
134.33 |
| Mar 2020 |
0.5 |
0.7 |
149 |
134.33 |
| Apr 2020 |
0.6 |
0.8 |
82 |
121.67 |
| May 2020 |
0.7 |
1.0 |
134 |
114.33 |
| Jun 2020 |
0.7 |
1.2 |
127 |
129.33 |
| Jul 2020 |
0.7 |
1.2 |
127 |
132.33 |
| Aug 2020 |
0.6 |
1.2 |
143 |
122.00 |
| Sep 2020 |
0.6 |
1.2 |
96 |
115.00 |
| Oct 2020 |
0.6 |
1.1 |
106 |
101.67 |
| Nov 2020 |
0.6 |
0.8 |
103 |
112.00 |
| Dec 2020 |
0.7 |
0.8 |
127 |
90.33 |
| Jan 2021 |
0.7 |
0.7 |
41 |
99.67 |
| Feb 2021 |
0.7 |
0.7 |
131 |
112.67 |
| Mar 2021 |
0.7 |
0.8 |
166 |
134.00 |
| Apr 2021 |
0.6 |
0.8 |
105 |
133.33 |
| May 2021 |
0.6 |
0.8 |
129 |
125.00 |
| Jun 2021 |
0.6 |
1.1 |
141 |
136.33 |
| Jul 2021 |
0.5 |
1.1 |
139 |
136.33 |
| Aug 2021 |
0.5 |
1.0 |
129 |
127.00 |
| Sep 2021 |
0.5 |
0.7 |
113 |
114.67 |
| Oct 2021 |
0.5 |
0.7 |
102 |
106.00 |
| Nov 2021 |
0.5 |
0.6 |
103 |
95.00 |
| Dec 2021 |
0.5 |
0.6 |
80 |
76.67 |
| Jan 2022 |
0.5 |
0.7 |
47 |
78.33 |
| Feb 2022 |
0.5 |
0.7 |
108 |
103.00 |
| Mar 2022 |
0.5 |
0.4 |
154 |
117.33 |
| Apr 2022 |
0.4 |
0.4 |
90 |
124.00 |
| May 2022 |
0.4 |
0.4 |
128 |
104.00 |
| Jun 2022 |
0.4 |
0.4 |
94 |
125.33 |
| Jul 2022 |
0.4 |
0.4 |
154 |
137.67 |
| Aug 2022 |
0.4 |
0.4 |
165 |
148.00 |
| Sep 2022 |
0.5 |
0.4 |
125 |
140.33 |
| Oct 2022 |
0.5 |
0.4 |
131 |
152.33 |
| Nov 2022 |
0.5 |
0.3 |
201 |
163.33 |
| Dec 2022 |
0.5 |
0.3 |
158 |
137.67 |
| Jan 2023 |
0.5 |
0.3 |
54 |
114.00 |
| Feb 2023 |
0.6 |
0.3 |
130 |
127.67 |
| Mar 2023 |
0.6 |
0.3 |
199 |
156.00 |
| Apr 2023 |
0.6 |
0.3 |
139 |
163.00 |
| May 2023 |
0.6 |
0.3 |
151 |
154.00 |
| Jun 2023 |
0.5 |
0.4 |
172 |
165.00 |
| Jul 2023 |
0.5 |
0.4 |
172 |
175.33 |
| Aug 2023 |
0.7 |
0.4 |
182 |
171.67 |
| Sep 2023 |
0.7 |
0.4 |
161 |
165.67 |
| Oct 2023 |
0.8 |
0.4 |
154 |
163.67 |
| Nov 2023 |
0.9 |
0.3 |
176 |
157.33 |
| Dec 2023 |
1.0 |
0.4 |
142 |
127.00 |
| Jan 2024 |
1.1 |
0.4 |
63 |
131.33 |
| Feb 2024 |
1.2 |
0.4 |
189 |
167.67 |
| Mar 2024 |
1.2 |
0.3 |
251 |
208.67 |
| Apr 2024 |
1.2 |
0.3 |
186 |
|
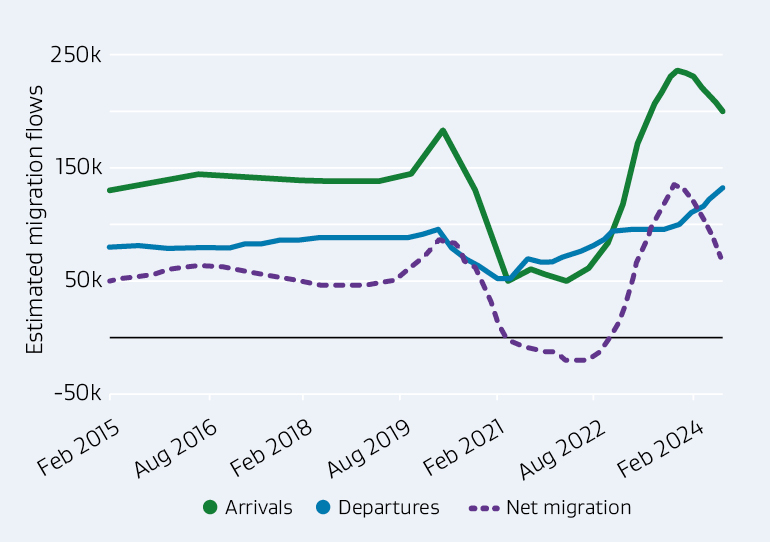
Migration flows
Estimated net migration hit a record high in late 2023, peaking at 136,600 for the year ended October 2023. It has since fallen to 73,300 for the year ended June 2024.
Annual migrant arrivals remain above thelong-run average, at over 204,500 to June 2024, but are offset by steady growth in the number of migrant departures over the past 18 months.
Text description for graphs - Migration flows
Line graph depicting estimated migration flows (arrivals, departures, and net migration) from 2015 to 2024.
| Year ended |
Arrivals |
Departures |
Net migration |
| Jan-17 |
143,333 |
80,864 |
62,469 |
| Feb-17 |
142,943 |
81,319 |
61,624 |
| Mar-17 |
142,588 |
81,239 |
61,349 |
| Apr-17 |
142,165 |
81,349 |
60,816 |
| May-17 |
141,945 |
82,021 |
59,924 |
| Jun-17 |
142,257 |
82,724 |
59,533 |
| Jul-17 |
142,166 |
83,421 |
58,745 |
| Aug-17 |
142,285 |
84,251 |
58,034 |
| Sep-17 |
141,569 |
85,033 |
56,536 |
| Oct-17 |
141,124 |
85,771 |
55,353 |
| Nov-17 |
140,608 |
86,090 |
54,518 |
| Dec-17 |
140,102 |
86,822 |
53,280 |
| Jan-18 |
140,031 |
86,947 |
53,084 |
| Feb-18 |
138,857 |
86,991 |
51,866 |
| Mar-18 |
139,003 |
88,071 |
50,932 |
| Apr-18 |
138,629 |
88,438 |
50,191 |
| May-18 |
138,652 |
88,739 |
49,913 |
| Jun-18 |
138,055 |
89,060 |
48,995 |
| Jul-18 |
138,032 |
89,420 |
48,612 |
| Aug-18 |
138,565 |
89,685 |
48,880 |
| Sep-18 |
139,004 |
89,576 |
49,428 |
| Oct-18 |
139,009 |
89,641 |
49,368 |
| Nov-18 |
138,959 |
89,722 |
49,237 |
| Dec-18 |
139,014 |
89,447 |
49,567 |
| Jan-19 |
138,920 |
89,815 |
49,105 |
| Feb-19 |
139,206 |
89,695 |
49,511 |
| Mar-19 |
139,035 |
89,351 |
49,684 |
| Apr-19 |
138,988 |
89,000 |
49,988 |
| May-19 |
139,903 |
88,782 |
51,121 |
| Jun-19 |
141,517 |
89,416 |
52,101 |
| Jul-19 |
142,920 |
89,114 |
53,806 |
| Aug-19 |
145,108 |
88,553 |
56,555 |
| Sep-19 |
147,896 |
88,769 |
59,127 |
| Oct-19 |
152,931 |
89,333 |
63,598 |
| Nov-19 |
159,429 |
91,704 |
67,725 |
| Dec-19 |
165,742 |
93,154 |
72,588 |
| Jan-20 |
171,637 |
94,371 |
77,266 |
| Feb-20 |
179,500 |
94,394 |
85,106 |
| Mar-20 |
184,884 |
93,204 |
91,680 |
| Apr-20 |
177,317 |
87,390 |
89,927 |
| May-20 |
168,432 |
80,970 |
87,462 |
| Jun-20 |
159,697 |
74,861 |
84,836 |
| Jul-20 |
149,173 |
70,670 |
78,503 |
| Aug-20 |
140,245 |
67,827 |
72,418 |
| Sep-20 |
130,893 |
65,912 |
64,981 |
| Oct-20 |
119,127 |
63,326 |
55,801 |
| Nov-20 |
105,752 |
58,784 |
46,968 |
| Dec-20 |
91,444 |
54,600 |
36,844 |
| Jan-21 |
76,572 |
51,573 |
24,999 |
| Feb-21 |
60,524 |
51,035 |
9,489 |
| Mar-21 |
49,189 |
50,971 |
-1,782 |
| Apr-21 |
53,667 |
56,415 |
-2,748 |
| May-21 |
57,545 |
61,745 |
-4,200 |
| Jun-21 |
59,928 |
66,513 |
-6,585 |
| Jul-21 |
61,880 |
69,487 |
-7,607 |
| Aug-21 |
59,894 |
69,971 |
-10,077 |
| Sep-21 |
57,284 |
68,105 |
-10,821 |
| Oct-21 |
56,155 |
67,354 |
-11,199 |
| Nov-21 |
55,447 |
68,067 |
-12,620 |
| Dec-21 |
55,459 |
70,409 |
-14,950 |
| Jan-22 |
53,995 |
71,611 |
-17,616 |
| Feb-22 |
51,886 |
71,979 |
-20,093 |
| Mar-22 |
54,171 |
73,629 |
-19,458 |
| Apr-22 |
55,850 |
75,314 |
-19,464 |
| May-22 |
57,992 |
77,623 |
-19,631 |
| Jun-22 |
61,325 |
79,017 |
-17,692 |
| Jul-22 |
67,025 |
81,529 |
-14,504 |
| Aug-22 |
74,184 |
84,989 |
-10,805 |
| Sep-22 |
83,919 |
89,088 |
-5,169 |
| Oct-22 |
92,809 |
92,676 |
133 |
| Nov-22 |
106,353 |
94,927 |
11,426 |
| Dec-22 |
119,440 |
94,540 |
24,900 |
| Jan-23 |
134,557 |
95,375 |
39,182 |
| Feb-23 |
154,312 |
96,992 |
57,320 |
| Mar-23 |
172,086 |
97,557 |
74,529 |
| Apr-23 |
183,235 |
97,748 |
85,487 |
| May-23 |
195,523 |
98,071 |
97,452 |
| Jun-23 |
207,730 |
98,841 |
108,888 |
| Jul-23 |
215,257 |
99,002 |
116,255 |
| Aug-23 |
227,095 |
99,654 |
127,441 |
| Sep-23 |
234,604 |
101,127 |
133,478 |
| Oct-23 |
239,136 |
102,545 |
136,592 |
| Nov-23 |
238,578 |
104,654 |
133,924 |
| Dec-23 |
236,983 |
108,210 |
128,773 |
| Jan-24 |
236,249 |
113,021 |
123,228 |
| Feb-24 |
231,774 |
115,155 |
116,619 |
| Mar-24 |
224,102 |
119,834 |
104,268 |
| Apr-24 |
223,797 |
128,208 |
95,589 |
| May-24 |
221,449 |
138,621 |
82,828 |
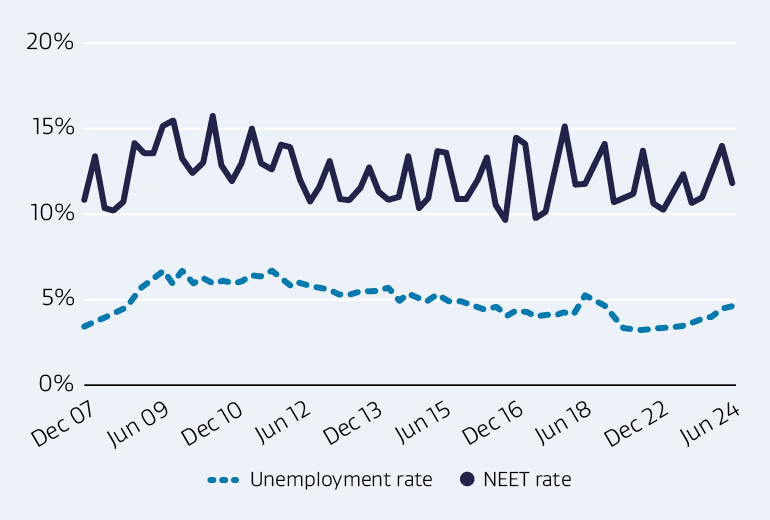
Labour market
Tightness in the labour market has eased as higher interest rates continue to dampen demand across the economy.
Unemployment rose to 4.6% in the June 2024 quarter with the Reserve Bank of New Zealand expecting it to peak at 5.4% in early to mid- 2025. The 15 to 24 year old not in education, employment or training (NEET) rate was 11.9%.
Wages (salary and wage rates, including overtime) rose 4.3% over the year to June 2024, outpacing annual inflation of 3.3% over the same period.
Text description for graph - Labour market
Line graph depicting unemployment rate and NEET rate from 2007 to 2024.
| Quarter |
Labour force participation rate (RHS) |
Total labour force |
Unemployment rate |
Underutilisation rate |
NEET rate |
| Mar-07 |
68.5 |
2245 |
3.9 |
9.9 |
13 |
| Jun-07 |
68.5 |
2250 |
3.6 |
9.8 |
10.4 |
| Sep-07 |
68.2 |
2245 |
3.6 |
9 |
9.7 |
| Dec-07 |
68.4 |
2255 |
3.4 |
9.2 |
10.8 |
| Mar-08 |
68.4 |
2268 |
3.8 |
10.3 |
13.5 |
| Jun-08 |
68.3 |
2266 |
3.8 |
10 |
10.6 |
| Sep-08 |
68.4 |
2273 |
4.1 |
10.5 |
10.2 |
| Dec-08 |
68.9 |
2296 |
4.4 |
11.3 |
10.8 |
| Mar-09 |
67.9 |
2267 |
5 |
12.3 |
14.3 |
| Jun-09 |
68.3 |
2287 |
5.8 |
13.7 |
13.7 |
| Sep-09 |
67.7 |
2276 |
6.2 |
14.8 |
13.7 |
| Dec-09 |
67.8 |
2287 |
6.6 |
15 |
15.3 |
| Mar-10 |
67.4 |
2279 |
5.9 |
13.6 |
15.6 |
| Jun-10 |
67.8 |
2300 |
6.6 |
14.2 |
13.3 |
| Sep-10 |
67.8 |
2306 |
6.1 |
13.9 |
12.5 |
| Dec-10 |
67.5 |
2302 |
6.2 |
14 |
13.1 |
| Mar-11 |
67.9 |
2317 |
6 |
14 |
15.9 |
| Jun-11 |
67.9 |
2327 |
6.1 |
14.1 |
12.9 |
| Sep-11 |
67.9 |
2327 |
6 |
13.6 |
12 |
| Dec-11 |
67.8 |
2330 |
6.1 |
13.7 |
13.1 |
| Mar-12 |
68.1 |
2340 |
6.4 |
14.1 |
15.1 |
| Jun-12 |
68 |
2344 |
6.4 |
14.7 |
13 |
| Sep-12 |
67.9 |
2342 |
6.7 |
15.6 |
12.7 |
| Dec-12 |
67.5 |
2337 |
6.3 |
14.7 |
14.2 |
| Mar-13 |
67.2 |
2329 |
5.8 |
13 |
14.1 |
| Jun-13 |
67.5 |
2346 |
6 |
13.3 |
12.1 |
| Sep-13 |
68.1 |
2377 |
5.8 |
14.1 |
10.9 |
| Dec-13 |
68.3 |
2394 |
5.7 |
14 |
11.7 |
| Mar-14 |
68.6 |
2417 |
5.6 |
13.2 |
13.2 |
| Jun-14 |
68.3 |
2418 |
5.3 |
13.3 |
11 |
| Sep-14 |
68.6 |
2445 |
5.3 |
12.8 |
10.9 |
| Dec-14 |
69.3 |
2484 |
5.5 |
13.3 |
11.6 |
| Mar-15 |
69.4 |
2502 |
5.5 |
13.6 |
12.8 |
| Jun-15 |
69.1 |
2505 |
5.5 |
13.6 |
11.4 |
| Sep-15 |
68.4 |
2498 |
5.7 |
13.7 |
10.9 |
| Dec-15 |
68.3 |
2512 |
5 |
12.5 |
11.1 |
| Mar-16 |
69 |
2552 |
5.3 |
13.7 |
13.5 |
| Jun-16 |
70 |
2613 |
5.1 |
13.1 |
10.5 |
| Sep-16 |
70.1 |
2635 |
5 |
12.7 |
11 |
| Dec-16 |
70.7 |
2671 |
5.3 |
12.4 |
13.8 |
| Mar-17 |
70.9 |
2692 |
4.9 |
12.3 |
13.7 |
| Jun-17 |
70.4 |
2689 |
4.9 |
12 |
11 |
| Sep-17 |
71.2 |
2734 |
4.7 |
12.1 |
11 |
| Dec-17 |
71.2 |
2745 |
4.5 |
12.2 |
12 |
| Mar-18 |
71.1 |
2755 |
4.4 |
11.9 |
13.4 |
| Jun-18 |
71.2 |
2781 |
4.6 |
12.1 |
10.5 |
| Sep-18 |
71 |
2787 |
4 |
11.3 |
9.7 |
| Dec-18 |
70.9 |
2802 |
4.3 |
12.2 |
14.6 |
| Mar-19 |
70.6 |
2790 |
4.2 |
11.3 |
14.2 |
| Jun-19 |
70.6 |
2805 |
4.1 |
11.1 |
9.8 |
| Sep-19 |
70.6 |
2818 |
4.1 |
10.3 |
10.2 |
| Dec-19 |
70.4 |
2828 |
4.1 |
10.1 |
12.4 |
| Mar-20 |
70.7 |
2864 |
4.2 |
10.4 |
15.2 |
| Jun-20 |
70 |
2852 |
4.1 |
12 |
11.8 |
| Sep-20 |
70 |
2861 |
5.2 |
13.1 |
11.9 |
| Dec-20 |
70.2 |
2870 |
4.9 |
11.9 |
13 |
| Mar-21 |
70.4 |
2881 |
4.6 |
12.1 |
14.3 |
| Jun-21 |
70.6 |
2890 |
4 |
10.5 |
10.8 |
| Sep-21 |
71.1 |
2914 |
3.3 |
9.1 |
11 |
| Dec-21 |
71 |
2911 |
3.2 |
9.2 |
11.3 |
| Mar-22 |
71 |
2911 |
3.2 |
9.3 |
13.8 |
| Jun-22 |
70.9 |
2908 |
3.3 |
9.2 |
10.7 |
| Sep-22 |
71.6 |
2947 |
3.3 |
9 |
10.3 |
| Dec-22 |
71.8 |
2967 |
3.4 |
9.4 |
11.4 |
| Mar-23 |
72.1 |
3005 |
3.4 |
9.1 |
12.4 |
| Jun-23 |
72.4 |
3043 |
3.6 |
9.9 |
10.7 |
| Sep-23 |
72 |
3052 |
3.9 |
10.4 |
11.1 |
| Dec-23 |
71.9 |
3068 |
4 |
10.7 |
12.5 |
| Mar-24 |
71.5 |
3072 |
4.3 |
11.2 |
14.1 |
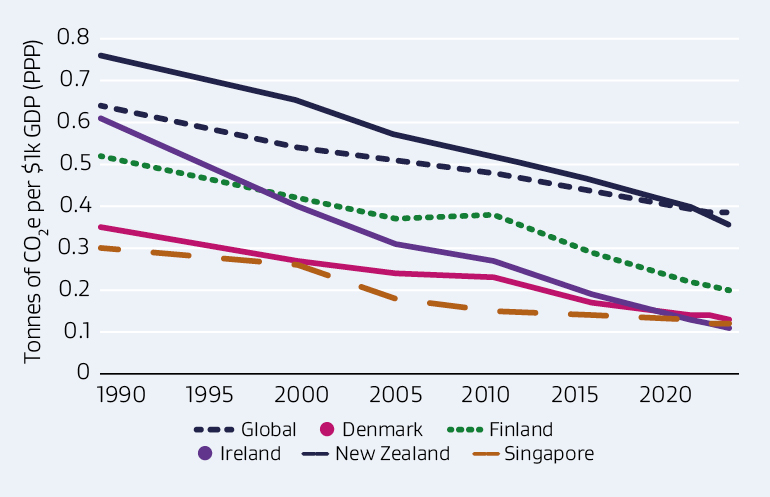
Emissions intensity
New Zealand’s emissions intensity is now below global averages.
New Zealand saw a steady fall in its emissions intensity between 1990 and 2022. Since 2021, it has been less intensive than the global average, with 0.38 tonnes of carbon dioxide equivalent (t CO2e) emissions per US$1,000 purchasing power parity (PPP).
Due to our comparative reliance on primary sector activity, New Zealand’s economy has a higher emissions intensity compared with other small, advanced economies.
Text description for graph - Emissions intensity
Line graph depicting tonnes of carbon dioxide equivalent emissions per $1000 USD purchasing power parity for Denmark, Finland, Ireland, New Zealand, Singapore and globally.
| Türkiye |
Uganda |
Ukraine |
United Arab Emirates |
United Kingdom |
United States |
| 0.33 |
1.16 |
1.12 |
0.42 |
0.44 |
0.61 |
| 0.33 |
0.8 |
1.22 |
0.4 |
0.31 |
0.51 |
| 0.27 |
0.69 |
0.83 |
0.41 |
0.26 |
0.44 |
| 0.29 |
0.67 |
0.71 |
0.49 |
0.23 |
0.4 |
| 0.26 |
0.61 |
0.63 |
0.45 |
0.17 |
0.34 |
| 0.26 |
0.54 |
0.53 |
0.43 |
0.15 |
0.28 |
| 0.25 |
0.54 |
0.49 |
0.44 |
0.14 |
0.28 |
| 0.24 |
0.52 |
0.55 |
0.42 |
0.14 |
0.28 |