Demographic information
This section reports on the demographic profile of 2024 survey respondents (Table 1).
On this page I tēnei whārangi
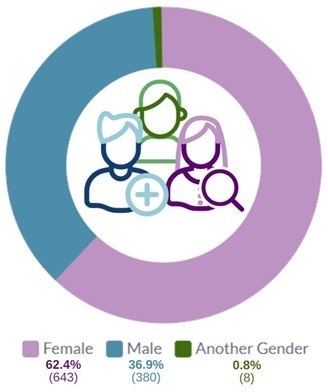
The largest ethnic groups of respondents were New Zealand European (57%), followed by Māori (8.8%), Indian (7.9%) and Pacific Peoples (5.2%). The sample also has a higher proportion of females (62.4%) than males (36.9%) or those identifying as another gender (0.8%), as shown in Figure 1.
Figure 1. Which gender do you most identify with?
N = 1,031
View image transcript – Figure 1
Nearly 40% of the sample were younger than 30 years (38.2%), including 8.4% who were aged 15 to 19 years. The largest grouping was those aged 30 to 50 years (43.1%). A further 18.6% were aged over 50 years, including 6.7% who were aged 60 years or older. This age profile is somewhat consistent with the 2022 He Tangata Hospitality and Tourism report that found the largest group to be 30 to 50 years. However, while the 2022 He Tangata report noted similar results in the age brackets of 15 to 19 (6.5%) and 30 to 49 (40.4%), the 2022 report noted significantly higher results for the 50+ (27.8%) and 60+ (10.3%) age groups.
Table 1. Demographic profile
Gender (n = 1,031)
| Characteristic | Number of responses | Percentage of responses |
|---|---|---|
| Male | 380 | 36.9% |
| Female | 643 | 62.4% |
| Another gender | 8 | 0.8% |
Age group (years) (n = 1,030)
| Characteristic | Number of responses | Percentage of responses |
|---|---|---|
| 15 to 19 | 87 | 8.4% |
| 20 to 24 | 161 | 15.6% |
| 25 to 29 | 146 | 14.2% |
| 30 to 34 | 151 | 14.7% |
| 35 to 39 | 130 | 12.6% |
| 40 to 44 | 107 | 10.4% |
| 45 to 49 | 56 | 5.4% |
| 50 to 54 | 67 | 6.5% |
| 55 to 59 | 56 | 5.4% |
| 60 to 64 | 31 | 3% |
| 65+ | 38 | 3.7% |
Ethnicity (n = 1,031)
| Characteristic | Number of responses | Percentage of responses |
|---|---|---|
| New Zealand European | 588 | 57% |
| Māori | 91 | 8.8% |
| Pacific peoples | 54 | 5.2% |
| Indian | 81 | 7.9% |
| Filipino | 37 | 3.6% |
| Chinese | 43 | 4.2% |
| Other Asian | 53 | 5.1% |
| Middle Eastern/Latin American/African | 22 | 2.1% |
| Other | 62 | 6% |
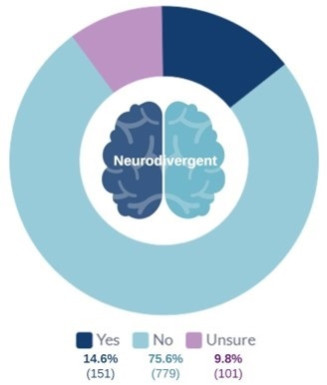
Almost 15% of respondents identified as neurodivergent (e.g., ADHD, dyslexia, autism) and close to 10% responded that they were ‘unsure’ (Figure 2).
Figure 2. Do you consider yourself to be neurodivergent?
N = 1,031
View transcript – Figure 2
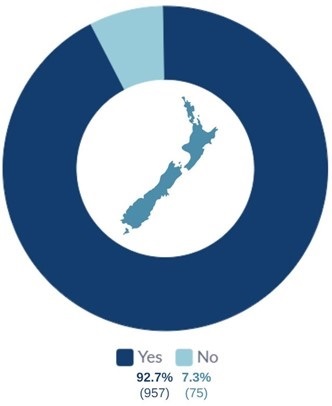
Most respondents (92.7%) were New Zealand citizens or permanent residents. The other 75 respondents were mainly in the 3 categories of accredited employer work visa (48.0%), another work visa (18.7%), and working holiday visa (9.3%).
Figure 3. Are you a New Zealand citizen or permanent resident?
N = 1,031
View image transcript – Figure 3
Table 2 shows that the 2 largest groups of respondents were those with a bachelor’s degree (28.1%), closely followed by those with NCEA or another school leaver qualification (27.4%). The results show that around two-thirds (66.9%) of respondents were tertiary qualified.
Table 2. What is your highest qualification
| Qualification | Number of responses | Percentage of responses |
|---|---|---|
| No qualifications | 46 | 4.5% |
| NCEA or other high school leaver qualification | 282 | 27.4% |
| Certificate | 138 | 13.4% |
| Diploma | 159 | 15.4% |
| Bachelor's degree | 290 | 28.1% |
| Postgraduate degree | 103 | 10% |
| Other | 13 | 1.3% |
(n = 1,031)
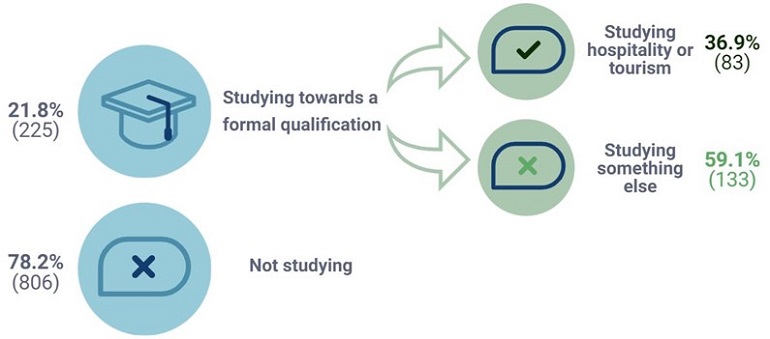
Nearly 80% of respondents were not currently studying, suggesting some opportunities for further development. Of the 225 respondents currently studying, just 83 (36.9%) were studying for a qualification in hospitality or tourism.
Figure 4. Are you studying toward a formal qualification (e.g. diploma or degree) in hospitality or tourism?
View image transcript – Figure 4
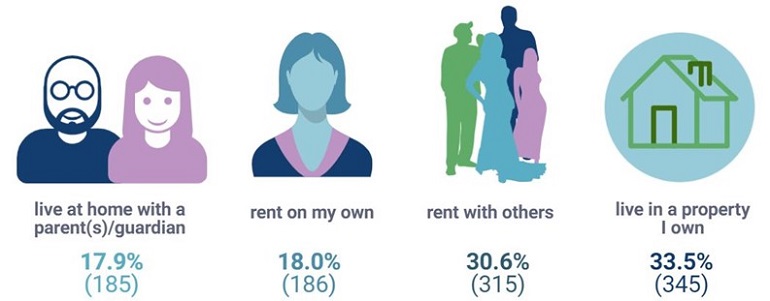
As figure 5 shows, many respondents lived in a property they owned (33.5%), followed by those who rented with others (30.6%).
Figure 5. What is your living situation?
Note: N = 1,031
View image transcript – Figure 5
Location of work
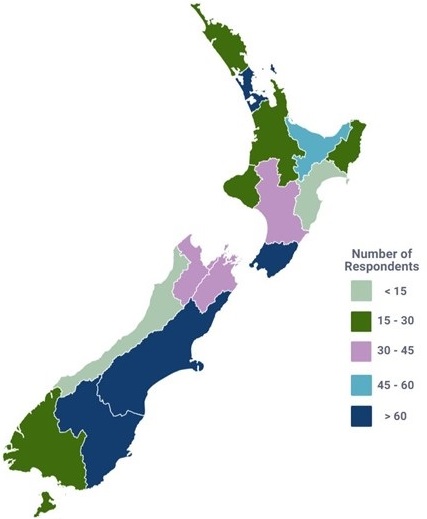
Figure 6. Location of work
Note: N = 1,029
A more detailed geographic information is available in Appendix 3.
View transcript – Figure 6
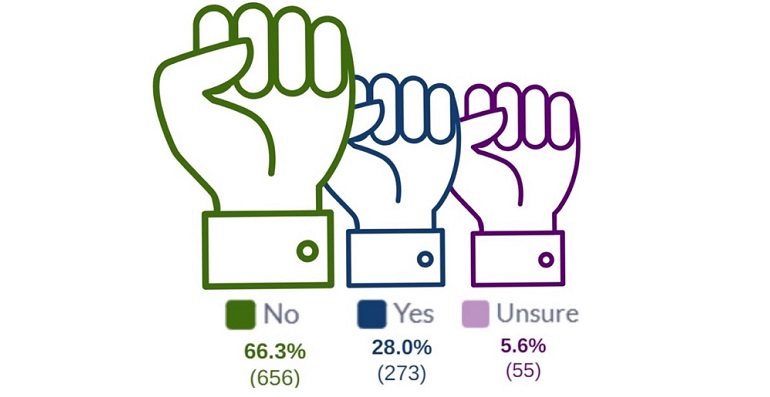
Two-thirds of respondents were not union members (Figure 7), and 42.0% of Māori and 48.6% of Filipino respondents were union members, as were 64.6% of Pacific Peoples that responded.
Higher union membership density was found in the younger age groups; for example, 42.6% of those younger than 25 years were union members. Union density was lowest in small organisations (9.2% of union members in organisations with 1 to 5 people, rising to 39.9% in organisations with 100 or more employees).
Figure 7. Union membership status
Note: N = 975
View image transcript – Figure 7
Tenure
Most respondents (35.8%) had worked in the industry for 3 years or less (Table 3), followed by 19.3% who had been in the industry for between 3 and 5 years, and 20.8% had careers of 5 to 10 years, with 24.1% having careers of 10 years or more. Compared with the 2022 He Tangata report, 28% of respondents had worked for 3 years or less, 19.7% had worked for 3 to 6 years, and 52.3% had careers of 6 years or more. Both surveys show that around half of the respondents have had relatively long-term careers of 5 years or more.
Table 3. How long have you worked in the hospitality or tourism sector?
| Duration | Number of responses | Percentage of responses |
|---|---|---|
| Less than 1 year | 99 | 9.6% |
| Between 1 and 3 years | 270 | 26.2% |
| Between 3 and 5 years | 199 | 19.3% |
| Between 5 and 10 years | 215 | 20.8% |
| Between 10 and 20 years | 147 | 14.2% |
| More than 20 years | 102 | 9.9% |
Respondents by sub-sector
Accommodation provided the largest number of respondents (27.9%), followed by fast-food/takeaways (15.3%), restaurants and cafes (20.9%), tourism/travel/transport (19.7%), and other hospitality (13.1%). Similarly, in the 2022 He Tangata report, accommodation also provided the largest number of respondents (27.8%), followed by tourism/travel/transport (25.0%), restaurants and cafes (17.3%), fast food/takeaways (7.6%), and other hospitality (7.3%).
Organisation size
Most (69.8%) of the hospitality, travel and tourism businesses were small and medium-sized enterprises with fewer than 50 employees (Table 4). A significant percentage of those small and medium-sized enterprises were very small organisations, with 44.1% having fewer than 20 employees. A total of 14.6% of organisations had 50 to 99 employees, and a significant 15.6% of businesses had over 100 staff. The 2022 He Tangata report showed a very similar results.
Table 4. Approximately how many people are employed in your place of work?
| Number | Number of responses | Percentage of responses |
|---|---|---|
| 1 to 5 | 138 | 13.4% |
| 6 to 19 | 317 | 30.7% |
| 20 to 49 | 265 | 25.7% |
| 50 to 99 | 151 | 14.6% |
| 100+ | 161 | 15.6% |
Front-line staff vs managers/supervisors
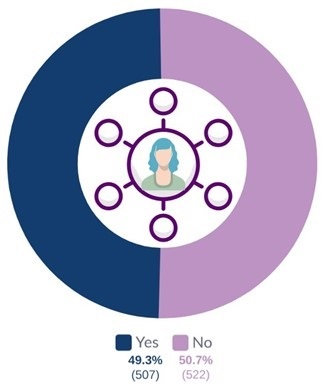
The survey showed a nearly even split between managers and supervisors (49.3%) and front-line/non-managerial workers (50.7%) (Figure 8).
Figure 8. Do you manage staff?
Note: N = 1,029
View image transcript – Figure 8
Employees by sector
The largest percentage (18.3%) of front-line employees were from the fast-food sector (see appendix 2), followed by waiters and food and beverage attendants (13.5%), other hospitality roles (11.8%), chefs/kitchen hands (11.6%), administration/marketing roles (10.8%), housekeeping/cleaners (9.4%), tourism and travel (7.4%), hotel front office (7%), and transport/airlines (2.4%). Hospitality roles comprised 55.2% of the front-line roles, whereas tourism, travel, accommodation and administration comprised 37%. The 2022 He Tangata report did not capture front-line roles.

