Safety, bullying, and burnout
The Maslach Burnout Inventory (MBI; Maslach et al., 2016) is a scientifically developed measure of burnout and is used widely in research studies around the world.
On this page
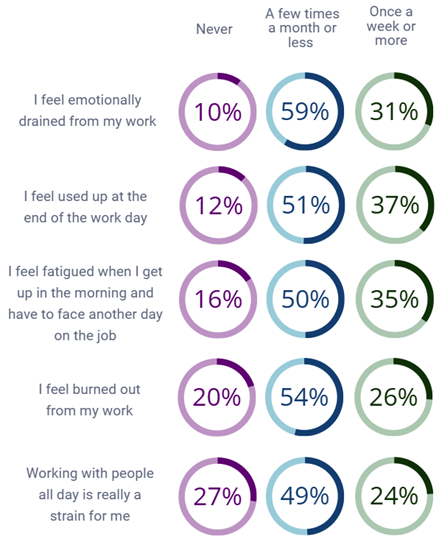
The 5 main questions from the inventory listed below were used to calculate emotional exhaustion. The higher the mean score, the higher the emotional exhaustion.
Figure 27. Feelings about work

View image transcript – Figure 27
The mean MBI score for all respondents was 17.71. For the emotional exhaustion sub-scale of the MBI, this score of 17.71 falls in the moderate range. There were significant variations in burnout when cross-tabulated with various demographic criteria.
Manager/supervisor vs front-line
Table 7 shows front-line staff reporting higher levels of burnout than managers and supervisors.
Table 7. Burnout scores for managers and non-managers (N = 979)
| Role | Mean | n | Standard deviation |
|---|---|---|---|
| Manager | 16.9 | 479 | 8.0 |
| Non-manager | 18.5 | 500 | 8.3 |
Role
Table 8 shows that amongst the front-line staff, fast-food workers had the highest burnout score (22.6), followed by chefs (21.5), and security/door staff (20.2). Customer-facing hospitality jobs were high scoring with waiters (18.8), bar staff (18.7) and baristas (19.4) all above the average score of 17.71. Kitchen hands (19.2) and cleaners (19.1) also scored above-average levels of burnout. Tourism roles all returned below-average burnout scores, with the office and administration roles showing the lowest levels of emotional exhaustion, with scores between 14.4 and 17.6. Tour guides scored the lowest levels of burnout, with a score of 12.5.
Table 8. Burnout scores by role (N = 478)
| Role | Mean | n | Standard deviation |
|---|---|---|---|
| Fast-food worker | 22.6 | 87 | 7.9 |
| Chef | 21.5 | 22 | 6.4 |
| Security/door staff | 20.3 | 4 | 11.8 |
| Gaming operator | 19.8 | 4 | 14.1 |
| Barista | 19.4 | 20 | 7.5 |
| Kitchen hand | 19.2 | 33 | 7.5 |
| Cleaner | 19.1 | 14 | 8.5 |
| Wait person/food and beverage attendant | 18.9 | 63 | 8.2 |
| Bar person | 18.7 | 27 | 7.8 |
| Front office | 18.6 | 33 | 8.8 |
| Tourism sales/service | 17.6 | 19 | 8.9 |
| Transport | 15.9 | 9 | 8.5 |
| Housekeeping | 15.6 | 30 | 9.2 |
| Administration | 15.5 | 39 | 6.5 |
| Airline cabin crew | 15.3 | 3 | 2.1 |
| Regional tourism organisation employee | 14.7 | 7 | 7.0 |
| Tourism business operator | 14.6 | 5 | 7.9 |
| IT, finance and marketing | 14.4 | 14 | 5.0 |
| Tour guide | 12.5 | 6 | 7.3 |
| Other | 17.6 | 39 | 8.9 |
Table 9 shows that respondents who reported being neurodivergent scored higher levels of emotional exhaustion than respondents who reported being neurotypical. Interestingly, those who were unsure if they were neurodivergent also reported higher than-average levels of burnout.
Table 9. Burnout scores for neurodivergent and neurotypical respondents (N = 978)
| Neurodiversity | Mean | n | Standard deviation |
|---|---|---|---|
| Yes | 21.9 | 147 | 8.8 |
| No | 16.6 | 740 | 7.6 |
| Unsure | 20.0 | 91 | 8.9 |
Table 10 shows that female respondents (18.2) scored higher levels of burnout than male respondents (16.7). Interestingly, those who identified as another gender reported the highest levels of burnout of any survey respondents (24.7; n = 7).
Table 10. Burnout scores by gender (N = 978)
| Gender | Mean | n | Standard deviation |
|---|---|---|---|
| Male | 16.8 | 363 | 8.2 |
| Female | 18.2 | 608 | 8.1 |
| Another gender | 24.7 | 7 | 7.1 |
There was a clear relationship between youth and higher burnout, with the youngest cohort (25 years and younger) scoring almost double (21) the burnout score of the oldest cohort (65 years and over at 11.9).
Table 11. Burnout scores by age (N = 977)
| Age | Mean | n | Standard deviation |
|---|---|---|---|
| < 25 | 21.0 | 234 | 8.2 |
| 25 to 34 | 18.6 | 277 | 7.9 |
| 35 to 44 | 16.8 | 227 | 8.2 |
| 45 to 54 | 14.9 | 119 | 7.1 |
| 55 to 64 | 14.6 | 84 | 6.9 |
| 65+ | 11.9 | 36 | 6.6 |
The results from the 2024 survey indicate burnout steadily reduced with increased tenure. The cohort with the shortest tenure (less than 1 year in the sector) scored higher (18.1) than the cohort with long service (more than 20 years at 15.9).
Table 12. Burnout scores by years of working in the sector (n = 979)
| Tenure | Mean | N | Standard deviation |
|---|---|---|---|
| Less than 1 year | 18.1 | 92 | 9.2 |
| Between 1 and 3 years | 18.9 | 261 | 8.0 |
| Between 3 and 5 years | 18.0 | 188 | 7.8 |
| Between 5 and 10 years | 17.2 | 201 | 8.0 |
| Between 10 and 20 years | 16.8 | 136 | 8.6 |
| More than 20 years | 15.9 | 101 | 7.8 |
Interestingly, mid-size SMEs (20 to 49 people) showed the highest level of burnout (18.7), while micro-organisations (1 to 5 people) showed the lowest (15.9).
Table 13. Burnout scores by organisational size (N = 979)
| Organisational size (people) | Mean | n | Standard deviation |
|---|---|---|---|
| 1-5 | 15.9 | 130 | 8.198 |
| 6-19 | 17.7 | 301 | 8.026 |
| 20-49 | 18.7 | 252 | 8.143 |
| 50-99 | 17.8 | 142 | 8.353 |
| 100+ | 17.5 | 154 | 8.344 |
Permanent full-time employees (17.0) and casuals (17.8) had similar scores, while contractors (13.2) showed significantly lower levels of burnout. Permanent part-time employees showed increased levels of burnout (19.4), but fixed-term and temporary workers showed the highest levels of burnout (21.8).
Table 14. Burnout scores by employment type (N = 879)
| Employment type | Mean | n | Standard deviation |
|---|---|---|---|
| Permanent part-time with employer | 19.4 | 233 | 8.1 |
| Permanent full-time with employer | 17.0 | 530 | 7.9 |
| Casual/on-call with employer | 17.8 | 75 | 8.5 |
| Fixed-term or temporary | 21.9 | 19 | 7.5 |
| Contractor | 13.3 | 17 | 8.0 |
| Don't know/Unsure | 22.8 | 5 | 9.4 |
Health and safety at work
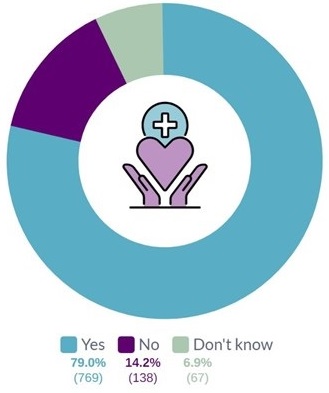
Figure 28 shows that 79.0% of respondents knew who to talk to about health and safety issues. Pacific (83.3%) and Middle Eastern/Latin American/African (86.4%) respondents were more certain than other ethnic groups about who to talk to regarding health and safety issues. Younger workers were less likely to know who to talk to about health and safety in their workplace. For those under 25 years, just 68.3% answered ‘yes’, compared with 21.7% who answered ‘no’, and 10.0% who answered unsure.
Figure 28. Do you know who to talk to about health and safety issues in your workplace?

N = 974
View image transcript – Figure 28
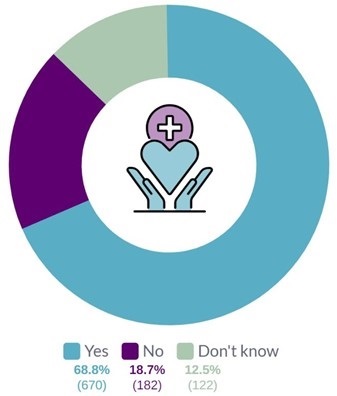
Figure 29 shows that just over two-thirds of respondents (68.8%) felt that health and safety risks were effectively managed in their workplaces. This indicates a modest improvement on the 2022 He Tangata results, which showed that 64.7% of respondents felt that health and safety risks were effectively managed in their workplaces. Chinese respondents agreed at a lower level (46.3%).
Figure 29. Do you feel that health and safety risks are managed effectively in your workplace?

N = 974
View image transcript – Figure 29
Bullying and harassment at work
Experiencing bullying and harassment
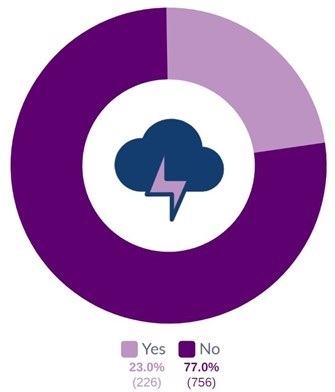
As Figure 30 shows, 23.0% of respondents personally experienced bullying or harassment in their workplace in the last 24 months, while 77.0% of respondents did not. This was fairly consistent across gender (Yes, for 21.6% of males and 23.8% of females). The 2022 He Tangata report returned almost identical results.
Māori respondents reported the highest rates of bullying or harassment (31.5%; n = 28). Small organisations (1 to 5 people) had the lowest rates of experiencing bullying or harassment (14.5%), rising steadily to 28.5% in 20 to 49 people organisations, and then falling back to 21.4% in organisations with 100 people or more.
Fixed-term/temporary workers showed the highest levels of experiencing bullying and harassment (36.8%) compared to rates around the low 20s for all other employment agreement types.
Figure 30. Have you personally experienced bullying or harassment in your workplace in the last 24 months?

N = 982
View image transcript – Figure 30
Just 17.0% of tourism, travel and accommodation workers reported experiencing bullying and harassment in the past 24 months, compared to 23.0% of hospitality workers.
The types of tourism and accommodation businesses that reported the highest levels of harassment were water transport and cruises (25.0%), adventure and outdoor (24.2%), attractions, conferences and events (19.4%), tour services (19.2%), and accommodation (18.6%). The business types with the lowest rates of reported bullying and harassment were culture and heritage (0%), regional tourism organisations (4.5%), and travel agencies (8.0%).
In hospitality, the business types with the highest levels of reported bullying and harassment were casinos (62.5%), chartered clubs (50.0%), fast food (37.7%), restaurants (25.7%), and bars/pubs/nightclubs (25.4%). Business types with the lowest rates of reported bullying and harassment were cinemas (0%), cafes (22%) and catering/events (25%).
Witnessing bullying and harassment
In 2024, 32.4% of respondents reported witnessing bullying and harassment. By comparison, 33.9% of respondents in 2022 reported witnessing abuse.
Regarding having witnessed bullying or harassment of others in their workplace of others, Māori and Pacific Peoples reported the highest levels of agreement, at 42.7% and 42.9%, respectively. Small organisations (1–5 people) had the lowest rates of witnessed bullying and harassment at 19.2%, with the rest of the organisational sizes returning around 30% agreement.
Main offenders
In 2024, the main offenders of the reported bullying and harassment were owners/managers/supervisors in 38.6% of cases, co-workers/other employees in 35.0% of cases, and customers in 26.0% of cases.

