Employment and pay
This section presents pay data from the 2024 and 2022 surveys in 3 categories: hourly pay rates for front-line workers, hourly pay rates for managers and supervisors, and salary rates for those not on hourly pay rates.
On this page I tēnei whārangi
Hourly rate or salary
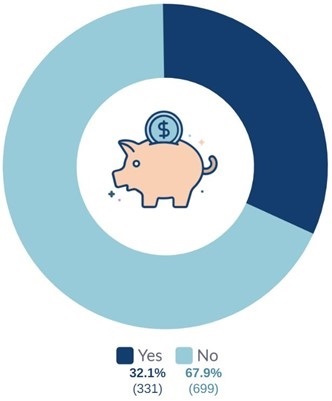
32.1% of the respondents were paid a salary, and 67.9% were on an hourly rate.
Figure 9. Are you paid a salary? (not paid by the hour)
Note: N = 1,029
View transcript – Figure 9
Hourly pay rates
In 2024, the minimum wage rate for those over 16 was $23.15 per hour, while the starting-out and training rate was $18.52 per hour. The living wage was $27.80 per hour as of September 1 2024.
In 2024, 43.7% of front-line employees were earning below $25, 36.6% were earning between $24 and $29.99, and 20.1% were earning $30 and over. By comparison, 10.3% of managers and supervisors were earning less than $25, 30.9% were earning between $24 and $29.99, and 58.6% were earning $30 and over (Figure 10).
Figure 10. Hourly rates for front-line workers and managers/supervisors

Front-line workers (n = 492)
Managers/supervisors (n = 479)
View image transcript – Figure 10
The 2024 survey captured a larger percentage of salaried employees in the lower 3 segments (52.1% earning less than $80,000) than in 2022 (39.5% earning less than $80,000). The 2024 survey also had almost half of the salaried workers in the top 3 segments (12.9% earning over $120,000), compared to 2022 (22.7% earning over $120,000).
Figure 11. Comparison of 2022 (n = 309) and 2024 (n = 309) salary rates

(n = 309)
View image transcript – Figure 11
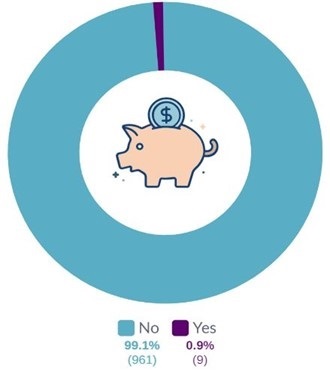
Figure 12. Are you paid the minimum wage?
Note: N = 970
View image transcript – Figure 12
Minimum wage
Figure 12 shows that only 0.9% of respondents were paid less than the minimum wage. This is a significant improvement on the 2022 He Tangata report, where 7.5% of respondents indicated they did not receive minimum wage.
Pay respective to the living wage hourly rate
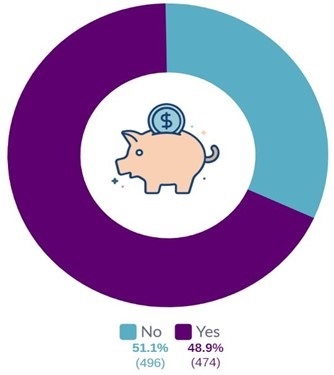
The survey data shows that 51.1% of respondents were paid less than the living wage (Figure 13). Furthermore, 71.8% of front-line workers were paid less than the living wage rate, while 30.1% of managers and supervisors earned less than the living wage rate. Split by gender, 57.3% of female workers, 40% of male workers and 87.5% of those who identified as another gender earned less than the living wage rate.
Of those who identified as being neurodivergent, 65.5% earned less than the living wage. A similar number was found for those unsure if they were neurodivergent (62%), compared with 46.9% of those who identified as neurotypical, earning less than the living wage.
The highest rates for earning less than the living wage were reported in fast food (82.7%), followed by restaurants and cafes (64.1%), other hospitality (56.3%), accommodation (37.7%) and tourism (23.3%).
There is a strong correlation between youth and earning less than the living wage. Rates steadily fall from 94% for the 15 to 19 age group to 28.2% for the 40 to 44 age group. Rates then start climbing again from 36% for the 45 to 49 age group to 50.9% for the 55 to 59 age group, and finally, 56.3% for those 65 and older.
Figure 13. Are you paid the living wage or above?
Note: N = 970
View image transcript – Figure 13
Paid or time off in lieu for working during statutory holidays
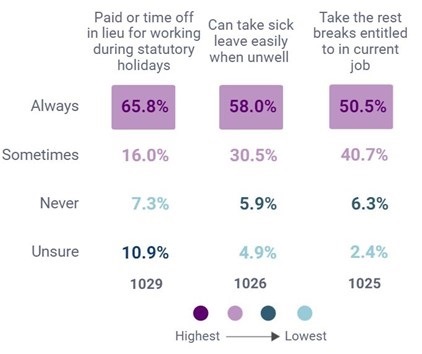
Figure 14 shows that 65.8% of respondents were ‘always’ and 16% were ‘sometimes’ getting paid or having time off in lieu for statutory holidays. Only 7.3% of respondents stated they never received this entitlement. The 2022 He Tangata report showed very similar results.
Small organisations (1 to 5 people) scored significantly below the averages for being paid for time off (45.3% always; 16.8% sometimes; and 15.3% never), while large organisations (100+ people) scored well above the average (73.3% always; 13.7% sometimes; and 5% never).
Sick leave
Concerningly, only 58% of respondents could always take sick leave when unwell, while 30.5% sometimes could and 5.9% never could. However, this is an improvement on the 2022 survey results, where 9.7% of respondents stated they could never take sick leave when unwell.
Small organisations (1 to 5 people) scored significantly below average for taking sick leave when needed (49.6% always; 30.7% sometimes; and 8% never), while large organisations (100+ people) scored well above the average (63.7% always; 28.7% sometimes; and 1.9% never).
Rest breaks
A very modest 50.5% of respondents reported they could always take their rest breaks, while 40.7% reported they sometimes could, and 6.3% stated they never did. There was no noteworthy difference in results from the 2022 survey.
Small organisations (1 to 5 people) scored significantly below average for taking rest breaks in Figure 14 (43.4% always; 36.8% sometimes; and 10.3% never), while large organisations (100+ people) scored well above the average (57.5% always; 37.5% sometimes; and 3.1% never).
Figure 14. Paid time off, sick leave and rest breaks
View image transcript – Figure 14
2024 holiday pay
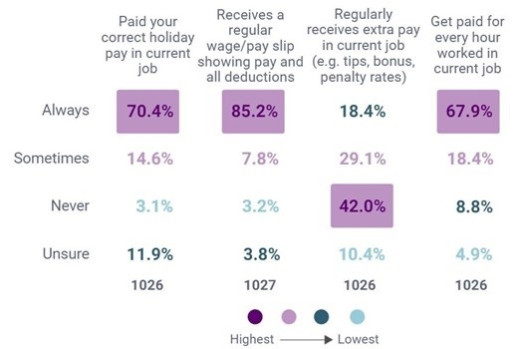
Compliance with holiday pay in 2024 remained very similar to the 2020 report with 70.4% of respondents reporting they were always paid correctly, 14.6% sometimes paid correctly, and just 3.1% never paid correctly. However, a significant 11.9% remained unsure about receiving their correct holiday pay. By comparison, the 2022 He Tangata report showed that 71.7% of respondents reported always receiving the correct holiday pay, 8.6% sometimes, and 4.7% never.
For permanent full-time employees, 92.4% indicated they always or sometimes got correct holiday pay, compared to 83.5% of permanent part-time workers and 78.2% of casual employees.
Extra pay
The 2024 survey shows an improvement in the number of respondents reporting receiving regular extra pay, with Figure 15 showing that 18.4% of respondents were always regularly receiving extra pay, 29.1% reporting they sometimes did, and 42.0% of respondents stating they never did. By comparison, the 2022 He Tangata report showed that 16.9% of respondents always regularly received extra pay, 34.1% sometimes did, and 42.6% of respondents stated they never did.
Small organisations (1 to 5 people) scored significantly below average for receiving extra pay (14.6% always; 25.5% sometimes; and 39.4% never), while large organisations (100+ people) scored well above (22.5% always; 31.3% sometimes; and 34.4% never).
Being paid for every hour worked
Figure 15 shows that 67.9% of respondents were always paid for every hour they worked, 18.4% sometimes were, and 8.8% of respondents stated they never were. The 2022 He Tangata report showed very similar results.
Small organisations (1 to 5 people) scored significantly below the averages for being paid for every hour they worked in Figure 15 (50.4% always; 19% sometimes; and 13.9% never), while large organisations (100+ people) scored well above (68.1% always; 18.1% sometimes; and 10.6% never).
Permanent full-time employees and fixed term/temporary workers registered the highest rates of unpaid work (88.5% and 73.7% for always and sometimes getting paid for every hour worked). Permanent part-time (11.7%) and fixed-term temporary employees (21.1%) undertook the least amount of unpaid work.
Figure 15. Pay questions
View image transcript – Figure 15
Fair pay
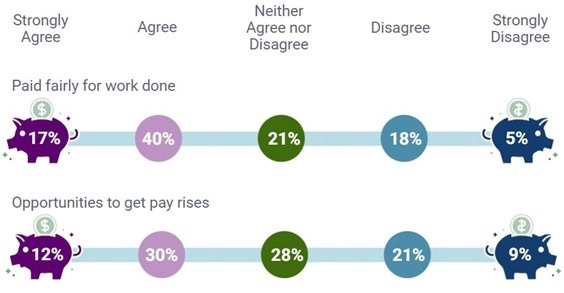
Most respondents (57.2%) agreed they were paid fairly for the work they did, while 22.3% disagreed (Figure 16). By comparison, in the 2022 He Tangata report, 47.7% of respondents agreed that they were paid fairly for the work they did, while 31.5% disagreed.
Permanent full-time (60.9%) and casual employees (65.4%) indicate the strongest agreement with being fairly paid, while fixed term/temporary (47.4%) and permanent part-time workers (46.9%) were less positive about the fairness of their pay.
Pay rises
Figure 16 shows that 41.9% of respondents agreed that they had opportunities for pay rises while 29.9% disagreed. The 2022 He Tangata survey results were very similar.
Figure 16.Fair pay and pay rises
Fair pay: N = 1,027
Pay rises: N = 991
View image transcript – Figure 16

