Respect, support, and satisfaction
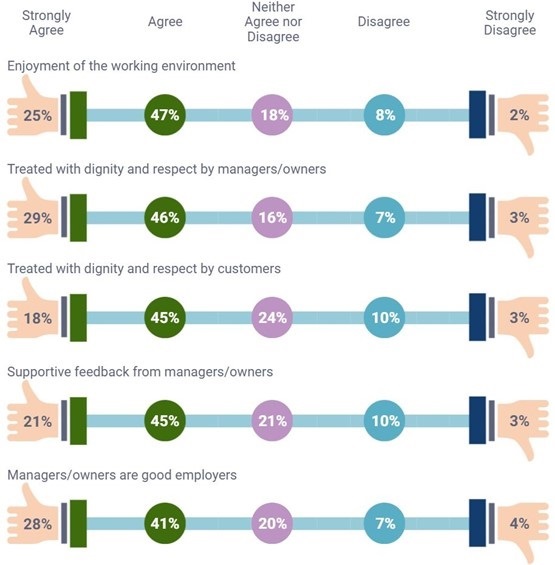
Encouragingly, almost 3 quarters (74.3%) of respondents felt they were treated with dignity and respect by managers/owners, an increase from the 2022 He Tangata report, which showed a 68.8% agreement.
On this page
Those working in other tourism (culture and heritage, transport, tourism and travel services) reported the highest agreement (80.1%), compared with fast-food workers (56.9%). Only 9.7% of respondents felt they were not treated with dignity or respect by superiors.
Of those who agreed that they were treated with dignity and respect by managers/owners (74.3%), Filipino respondents reported the highest levels of agreement (80.0%), followed by Indian respondents (78.8%) and Māori respondents (77.5%).
Younger workers under 25 years of age reported the lowest level of agreement (66.4%) for being treated with dignity and respect by managers/owners. Those identifying as another gender (n = 7) all answered that they were treated with dignity and respect by owners/managers, and 74.4% (n = 458) of women and 73.3% (n = 269) of men also agreed.
Figure 22. Dignity, respect and the work environment

Notes: N = 992; 988; 987; 987; 987
View image transcript – Figure 22
Permanent full-time workers (76.5%) and casuals (77.9%) reported the highest levels of agreement for being treated with respect by managers and owners, followed by permanent part-timers (70.8%) and fixed-term or temporary employees (63.1%).
Compared to the overall agreement for being treated with dignity by owners/managers (74.3%), the overall agreement for being treated with dignity by customers was lower at 62.7%. Fewer than 10% felt they were not treated with dignity or respect, but this time by customers (9.8%). By business type, those working in accommodation (73.4%) and then other tourism (culture and heritage, transport, tourism and travel services) reported the highest agreement (69.4%), compared with fast-food workers (43.8%).
Of those who agreed that customers treated them with dignity and respect (62.7%), Māori respondents reported lower levels of agreement (53.9%), and 32.6% were unsure.
Workers aged 25 or younger had the lowest level of agreement (51.5%) for being treated with dignity and respect by customers. Those who identified as neurodivergent also reported lower levels of agreement (57.3%) for this question. Permanent full-time workers reported the highest levels of agreement for being treated with respect by customers (66.1%), followed by casuals (57.2%), permanent part-timers (55.8%) and fixed-term or temporary employees (52.6%).
Enjoyment at work
Enjoyment at work is important as employee perceptions of fun at work can improve work attitudes and behaviours, enhance trust in co-workers and managers, increase job satisfaction and engagement, and decrease turnover intentions (Abdelmotaleb, 2024). A high level of enjoyment was notable from the survey, with 72% at least agreeing that they enjoyed their working environment (Figure 22), which is an increase from the 2022 He Tangata report, which showed a level of 69.4% enjoyment. Fewer than 10% said they did not find enjoyment and 18% were unsure.
For all ethnic groups, agreement by respondents that they enjoyed their workplace ranged from 70% to 78.4%. The one outlier were Chinese respondents, who agreed at just 60.0%, with a further 29.3% being neutral.
Those in the 45 to 55 year age group reported the highest levels of enjoyment (81.0%), with 70.1% for 55 to 64 years, and 86.4% for those aged 65 years and older. By comparison, just 59.5% of those younger than 25 years agreed that they enjoyed their working environment.
While permanent full-time workers, casuals and fixed term/temporary employees all registered around 76% agreement with enjoying the work environment, permanent part-time employees were considerably less happy at 59.7% agreement.
Respondents were asked if they got supportive feedback from managers/owners. As Figure 22 shows, around two-thirds (66.3%) agreed that this was the case, with low levels of disagreement (13.0%). Once more this shows an improvement on the 2022 results, where 59.3% of respondents felt they received supportive feedback.
There was an association between receiving supportive feedback from a supervisor and age, with higher levels of agreement found among those 45 years and over (76.9%). For those aged younger than 25 years, 60% agreed, 21.7% were unsure, and 18.3% disagreed.
There was clear agreement that respondents perceived managers/owners to be good employers (69.2%), with just 10.7% disagreeing. This shows a modest improvement over the 2022 figures, where 65.0% of respondents felt their managers were good employers. Agreement was lower (61.3%) for respondents who identified as neurodivergent.
Overall job satisfaction
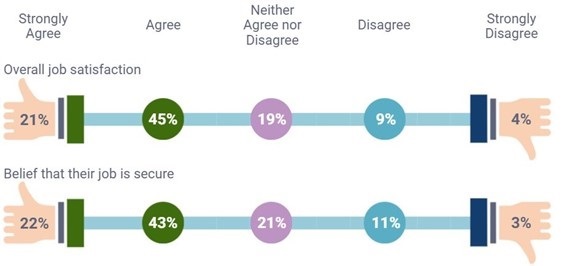
Given the positive ratings for enjoyment of the workplace, treatment at work, supportive feedback and managers/owners as good employers, it is not surprising that over two-thirds of respondents expressed positive overall job satisfaction (67.5%). Only 13.1% expressed dissatisfaction and 9.4% were unsure. Overall job satisfaction increased by approximately 5% from 62.2% in 2022 to 67.5% in 2024.
Job satisfaction agreement was highest for those in other tourism (culture and heritage, transport, tourism and travel services) (81.2%) and lowest for fast food (41.8%). Respondents with permanent full-time and fixed-term/temporary roles had higher rates of job satisfaction (74.2% and 73.7%), compared with casuals (61.1%) and permanent part-time employees (55.8%).
Figure 23. Job satisfaction and security

Job satisfaction: N = 986
Security: N = 986
View image transcript – Figure 23
Respondents aged 65 and over had the highest rates of job satisfaction (83.7%; n = 31), followed by those aged 45 to 54 (74.1%; n = 120). The lowest agreement rate (54.9%) was by respondents younger than 25 years. This was also the case for those who identified as neurodivergent (53.0%). Regarding gender, 67.7% of women, 67.4% of men, and 57.1% of those of another gender all agreed that they were satisfied with their jobs.
Managers/supervisors showed a significantly higher rate of job satisfaction (74.4%) than non-managers (60.9%), with managers being noticeably above the average for all respondents (67.5%) and non-managers being significantly below the average.
When asked about job security, most respondents believed their job was secure (65.1%), with a further 20.9% unsure and 14% disagreeing. The rate in the smallest organisations (1 to 5 people) was approximately 10% lower at 58.2% agreement compared to large organisations (100+ people) at 68.6% agreement.
Extremely high levels of agreement (90.9%) were found when respondents were asked if they cared about being useful/productive in a job.
Of all the questions asked in the survey, this one question the most positive result.
Figure 24. I care about being useful/productive in my job

N = 986.
View image transcript – Figure 24
High agreement was found across all age groups, with 97.3% agreement by those aged over 65 years and 85.6% for those aged 55 to 64. Clearly, respondents at all age levels cared about performing well at work. These results should also be considered in line with the results about wanting further development at work.
Strong concern for being in a profitable workplace was also found, with just over 3 quarters (76.1%) of respondents agreeing that profitability mattered. Only 7.2% of respondents disagreed that profitability mattered. Care for profitability ranged from 61.6% for those under 25 years to 86.6% for those aged 45 to 54 years. The highest group in agreement (89.1%) were those aged 65 years or older.
Results were also fairly consistent by gender, ranging from men (80.8%), women (73.3%) and another gender (71.4%). Large organisations had the lowest rates of ‘strongly agree’ with this statement (100+; 30.8%) compared with 49% in organisations with 6 to 19 people.
Figure 25. I care about my organisation being profitable

N = 986
View image transcript – Figure 25
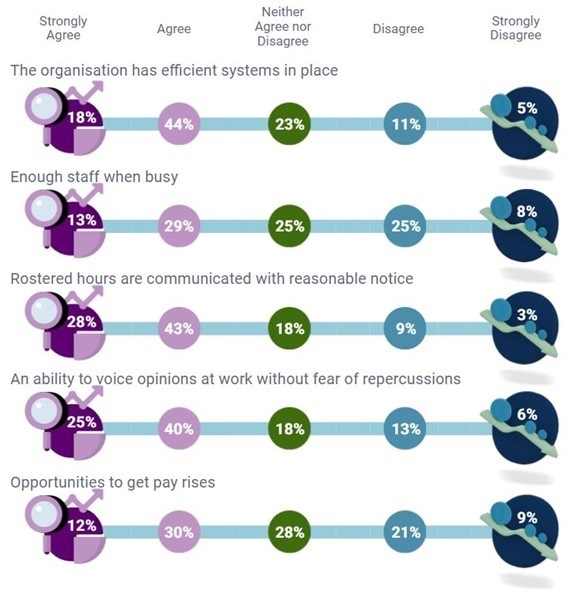
Compared with the questions about performance and profitability, there were lower levels of agreement (61.7%) when respondents were asked whether their organisation had efficient systems. Fewer than half of respondents agreed they had enough staff when busy (42.1%).
While it is encouraging that 71.0% of respondents agreed that rostered hours are communicated with reasonable notice (compared to 67.9% in 2022), there is still room for improvement on this front.
Figure 26. Organisational efficiency and communication

N= 985; 992; 992; 987; 991
View image transcript – Figure 26
Almost two-thirds of respondents agreed that they had the ability to voice their opinions at work without fear (64.3%). By comparison, only 59.9% of respondents in the 2022 survey felt they could speak freely. By business type, those working in other tourism (culture and heritage, transport, tourism and travel services) reported the highest agreement (73.1%) with their ability to voice their opinions, as opposed to fast-food workers (39.7%).
There is an association between voice and age, with younger workers agreeing to a lower degree (52.7%). This increased with age, with those aged 65 and older having the most ability to voice their opinions at work (80.0%). Fixed-term/temporary workers reported the highest ability to voice opinions (73.7%), followed by permanent full-time employees (69.7%) and casual workers (63.7%). Permanent part-timers showed the lowest levels of ability to voice their opinions (52.8%).

